Fig. A.4
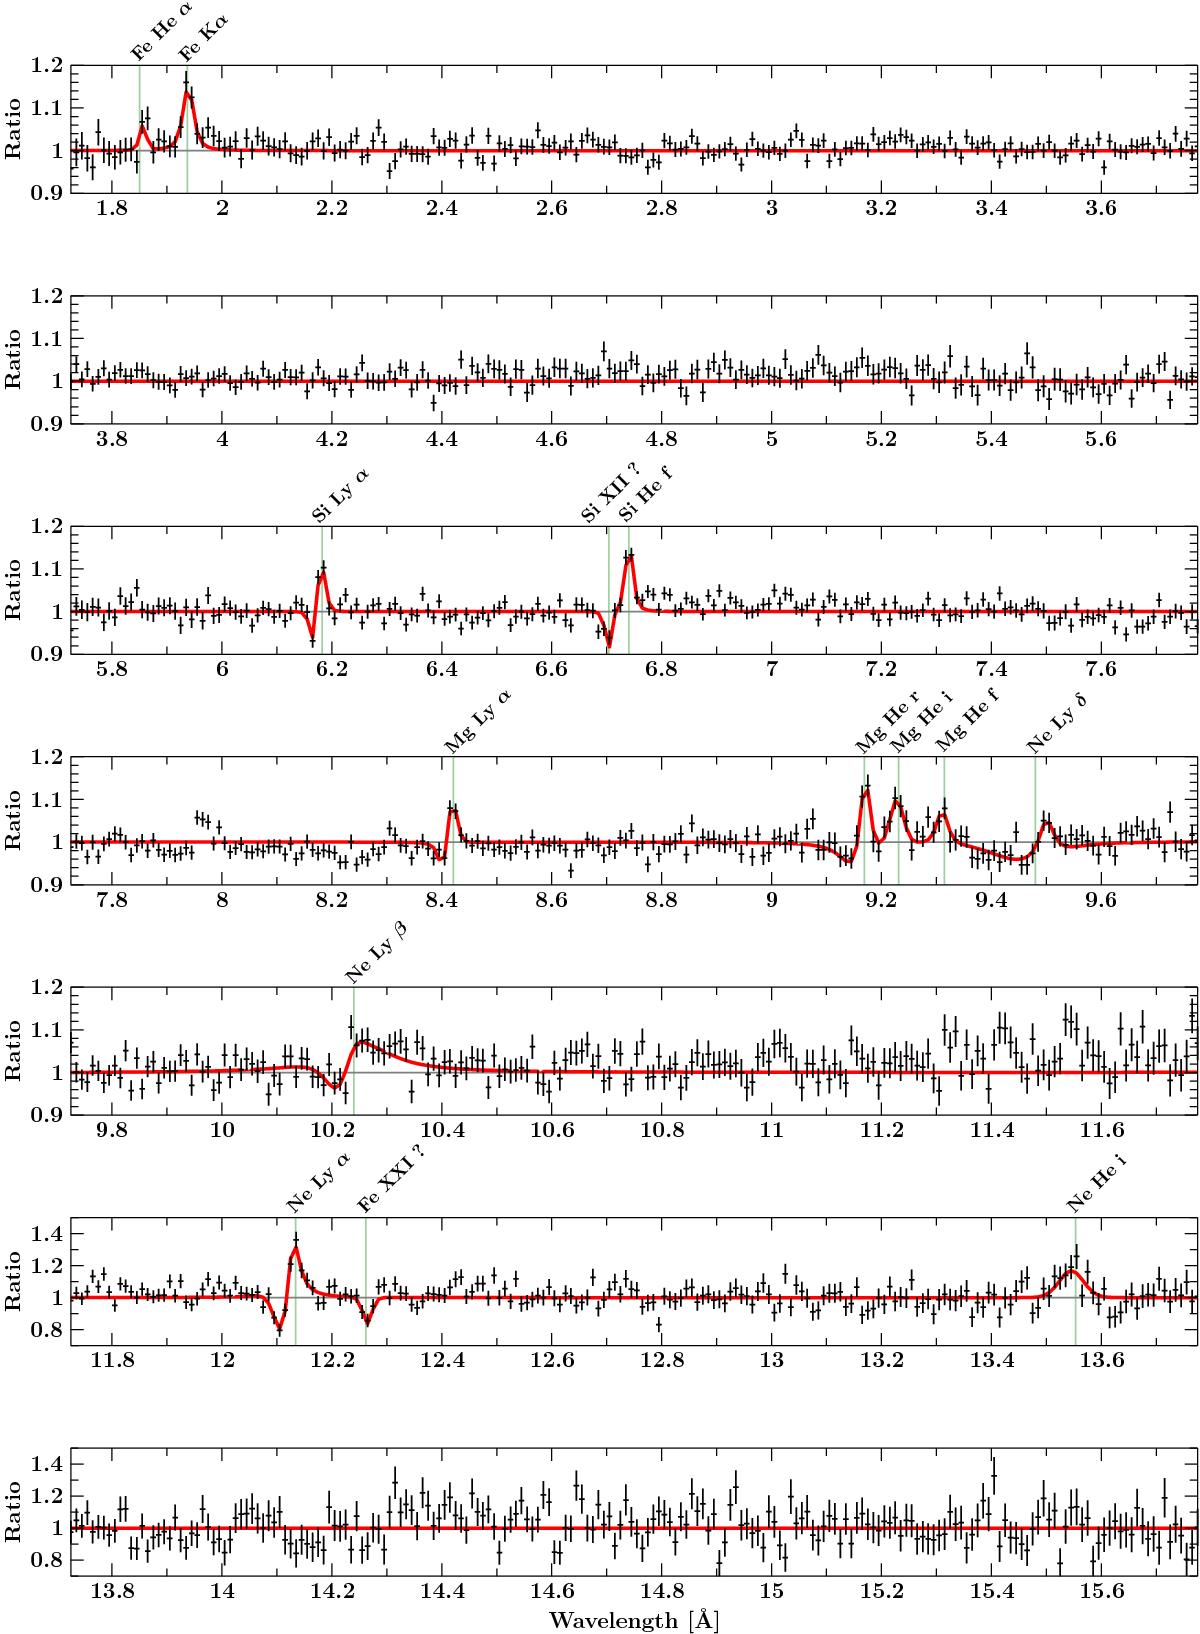
Spectrum of ObsID 11044, displayed as the ratio between data and absorbed power-law continuum model. The most prominent absorption and emission lines have been fitted with Voigt profiles. The Lyα lines of H-like Si, Mg, and Ne show clear P Cygni profiles. The absorption line at 6.70 Å, however, cannot be related to the emission line at 6.74 Å, if the latter is due to the (dipole-) forbidden transition of Si xiii.
Current usage metrics show cumulative count of Article Views (full-text article views including HTML views, PDF and ePub downloads, according to the available data) and Abstracts Views on Vision4Press platform.
Data correspond to usage on the plateform after 2015. The current usage metrics is available 48-96 hours after online publication and is updated daily on week days.
Initial download of the metrics may take a while.