Fig. A.3
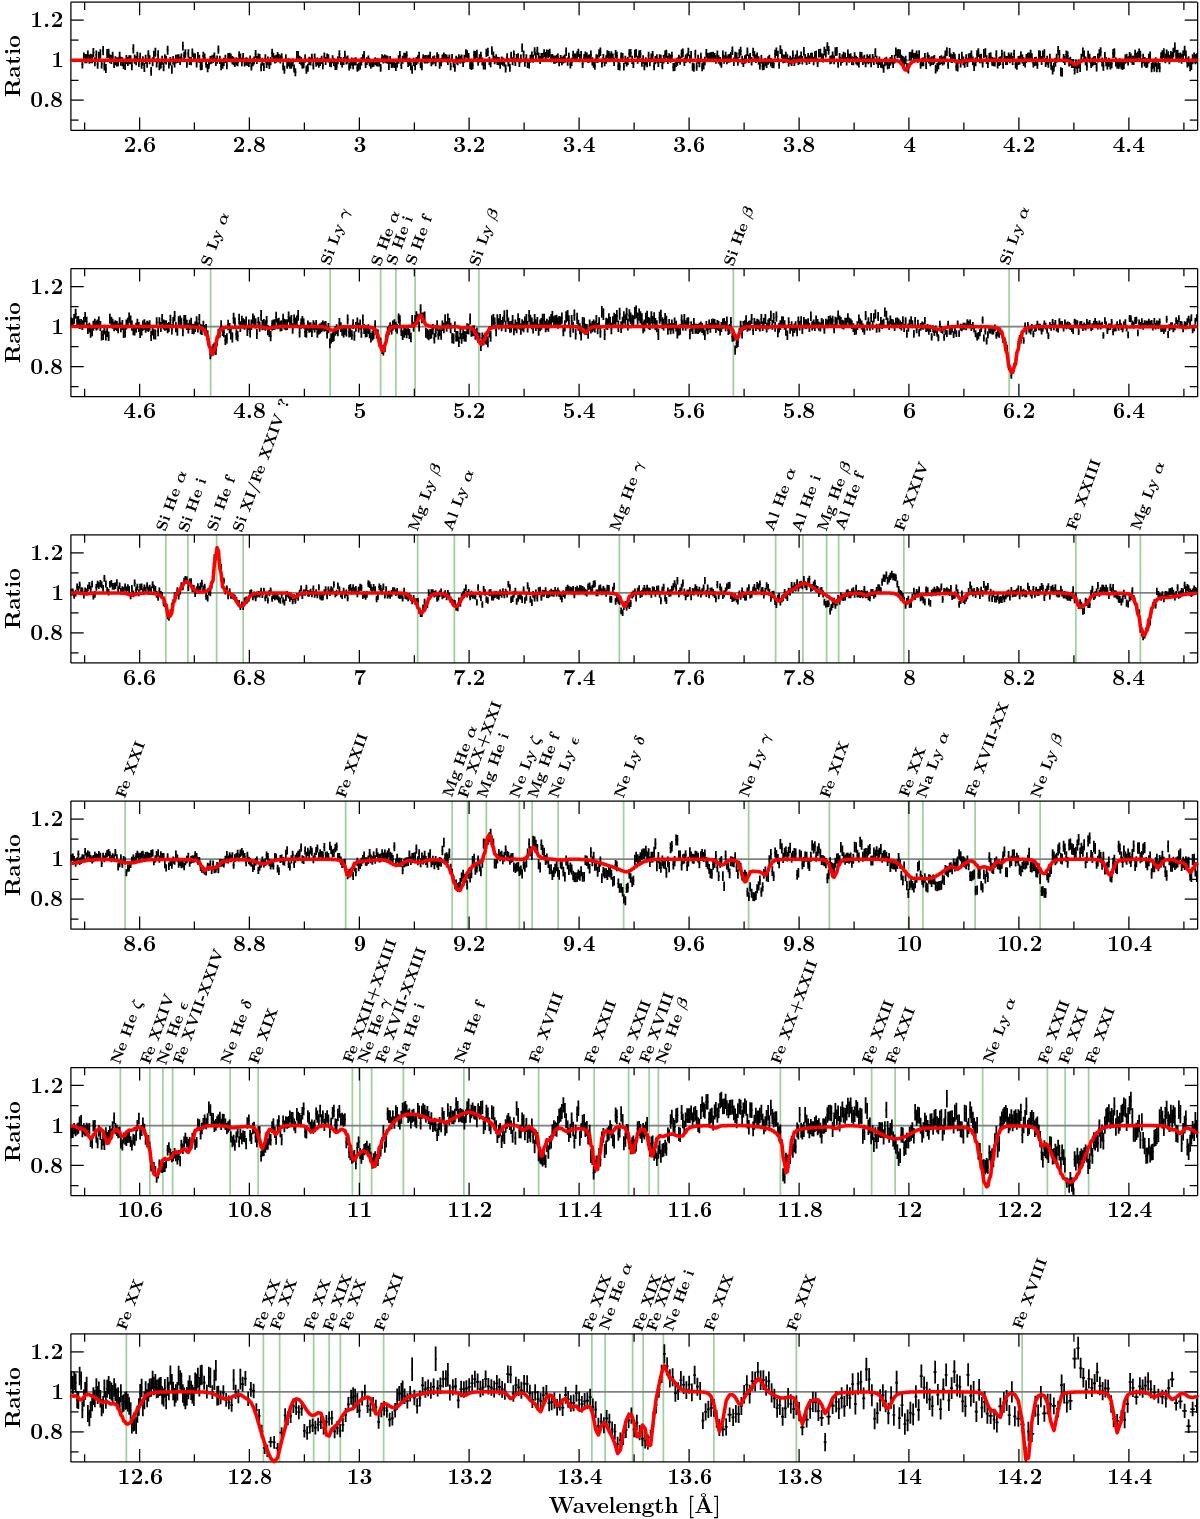
Non-dip spectrum of ObsID 3815 – displayed as the ratio between data and absorbed power-law continuum model – showing the H- and He-like absorption lines, as well as the i and f emission lines of the hot gas of the stellar wind. The spectra of HEG±1 and MEG±1 were combined and binned to the same signal-to-noise ratio (S/N = 10) as for fitting. Especially notable are lines of Ne xβ at 10.24 Å, Ne xγ at 9.71 Å, and Ne xδ at 9.48 Å, because they are much stronger in the data than the profiles that are predicted by the model. We did not manage to identify the emission feature at ~7.98Å. It is also visible in ObsID 1044 (Fig. A.4), but not in ObsIDs 8525 and 9847 (Figs. A.1 and A.2).
Current usage metrics show cumulative count of Article Views (full-text article views including HTML views, PDF and ePub downloads, according to the available data) and Abstracts Views on Vision4Press platform.
Data correspond to usage on the plateform after 2015. The current usage metrics is available 48-96 hours after online publication and is updated daily on week days.
Initial download of the metrics may take a while.