Fig. A.1
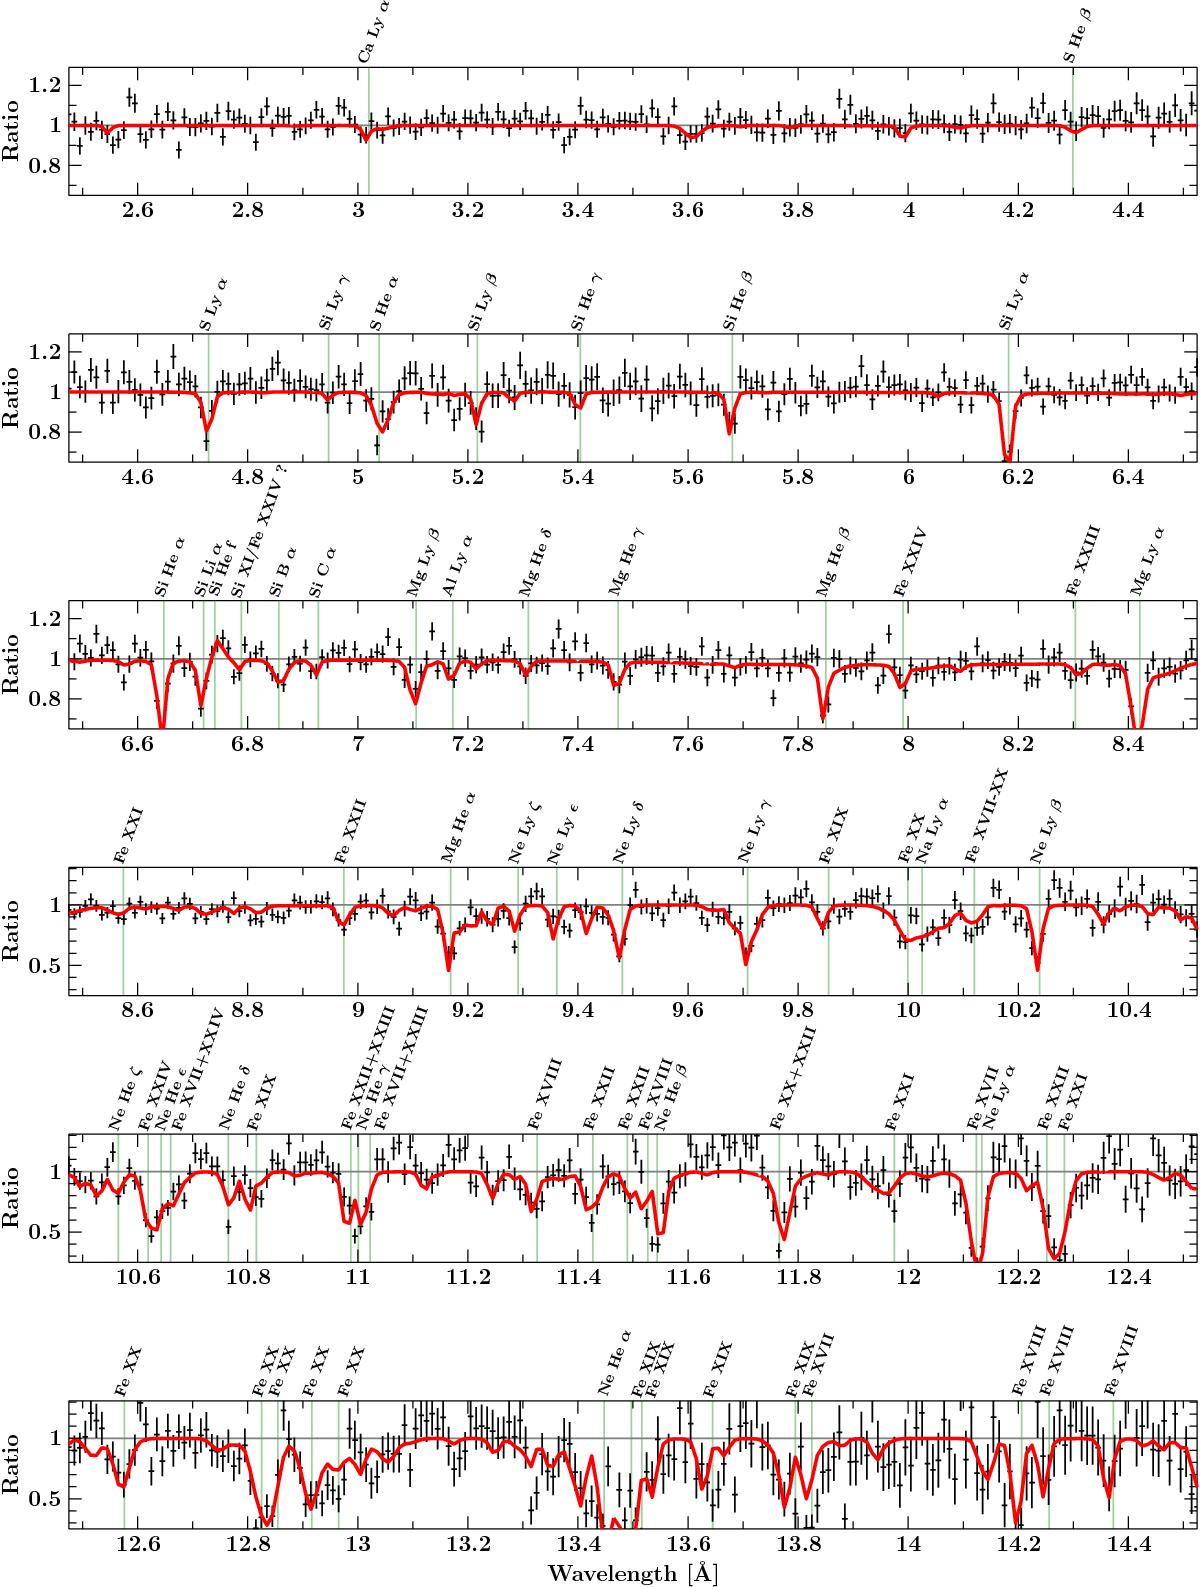
Non-dip spectrum of ObsID 8525 – displayed as the ratio between data and absorbed power-law continuum model – showing the absorption lines observed in the spectrum. Due to a relatively short exposure time of only 4.4 ks, the HEG spectra are worse than MEG at longer wavelengths. Data from HEG were therefore scaled to MEG data for visual reasons. The red line shows lines modeled with line series. Each of them is labeled at its rest wavelength. There are no significant emission lines in the spectrum, except the Si xiii forbidden line. Instead, absorption lines from Si xii (Li-like), possibly Si xi (Be-like), Si x (B-like), and Si ix (C-like), although quite weak, can be clearly identified in the “Si region” between 6.6 Å and 7 Å.
Current usage metrics show cumulative count of Article Views (full-text article views including HTML views, PDF and ePub downloads, according to the available data) and Abstracts Views on Vision4Press platform.
Data correspond to usage on the plateform after 2015. The current usage metrics is available 48-96 hours after online publication and is updated daily on week days.
Initial download of the metrics may take a while.