Fig. 12
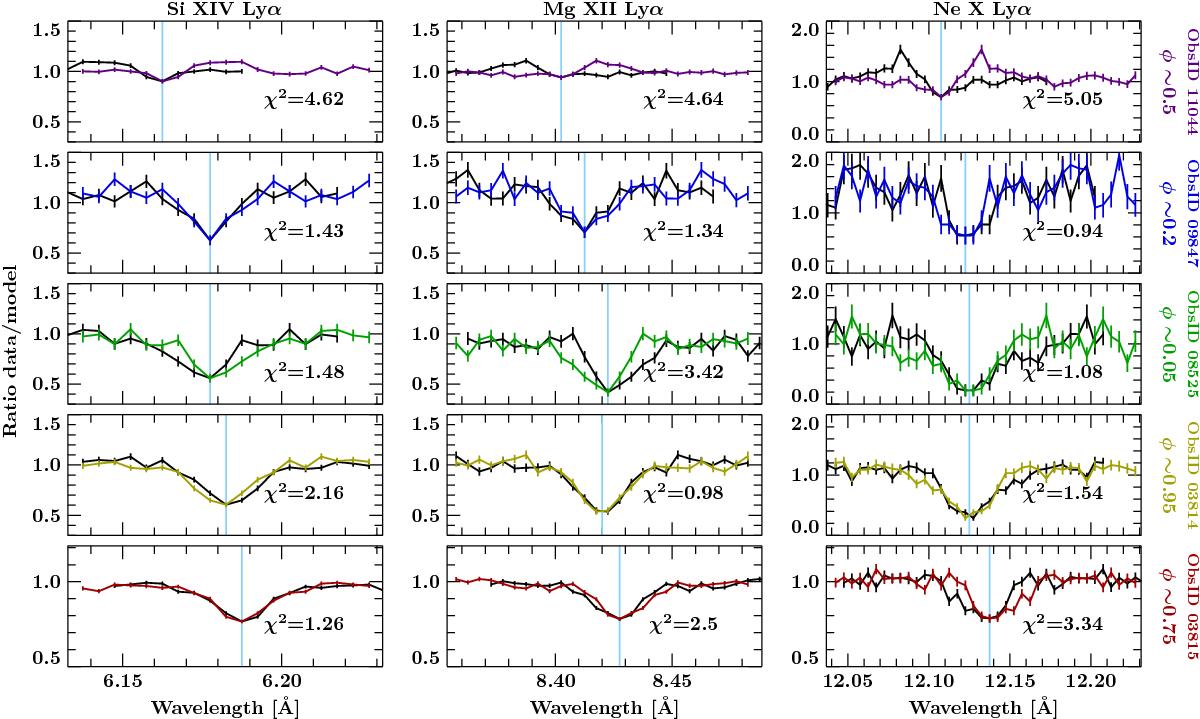
The same line profiles as in Fig. 11, but this time investigating the symmetry of the profiles. The chosen absorption lines have clear P Cygni profiles at phase φorb ~ 0.5. Other lines also show, however, asymmetric profiles. The colored profiles show the original ones, while the black profiles are mirrored at the energy bin with the lowest relative flux value.
Current usage metrics show cumulative count of Article Views (full-text article views including HTML views, PDF and ePub downloads, according to the available data) and Abstracts Views on Vision4Press platform.
Data correspond to usage on the plateform after 2015. The current usage metrics is available 48-96 hours after online publication and is updated daily on week days.
Initial download of the metrics may take a while.