Fig. 3
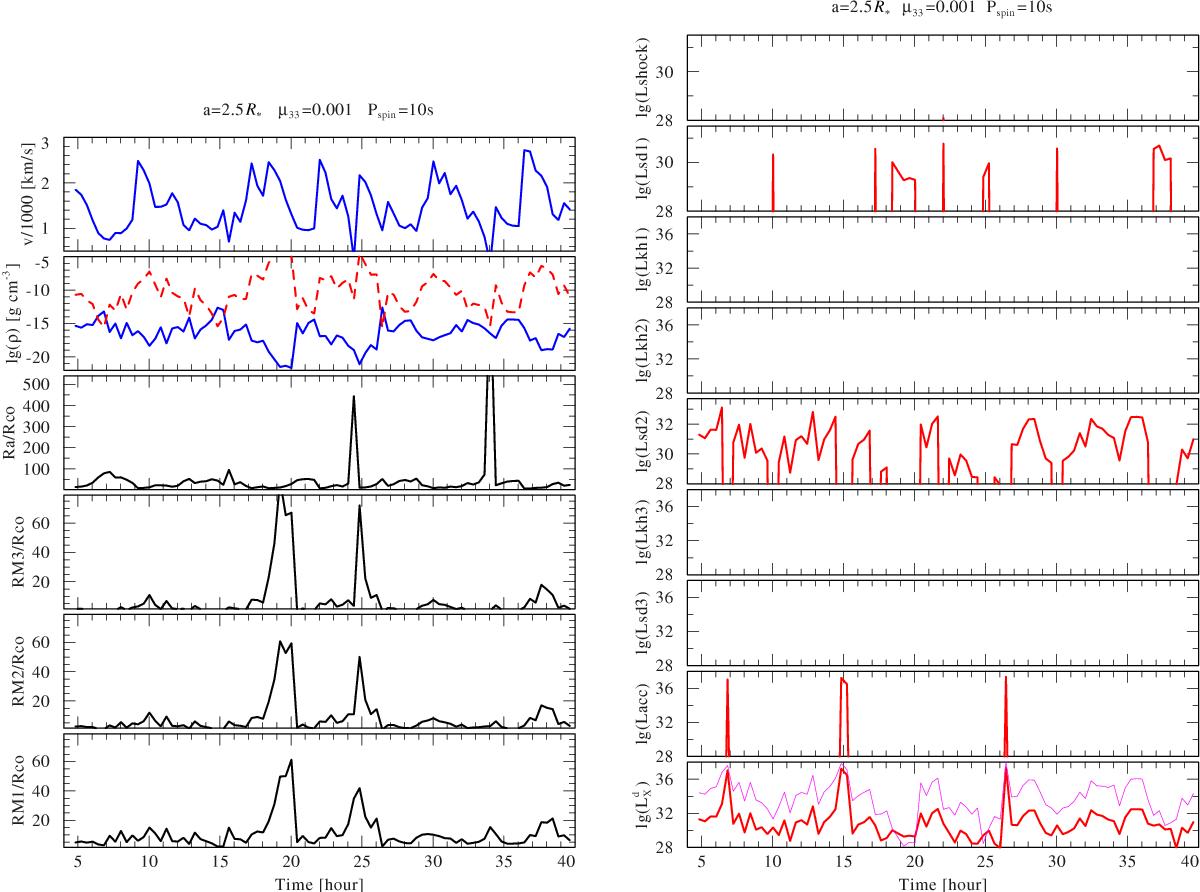
Results of the simulations of the accretion onto a NS using the nonstationary wind model introduced in Sect. 2 and taking into account the gating accretion mechanisms described in Sect. 3. The system parameters adopted in the simulation are shown above each figure (a separation of 2.5 R∗ corresponds to an orbital period of 9.1 days). Left figure: wind velocity and density as a function of time, and all relevant radii to be determined in the gating accretion model. In the density panel we also show the value of the critical density in Eq. (13) (red dashed line). Right figure (all panels): different contributions to the total X-ray luminosity of the system, which is given in the bottom panel, together with the corresponding X-ray luminosity that would be achieved by assuming the simplest Bondi-Hoyle scenario (magenta solid line; see Appendix A). Empty regions in each panel represent time intervals in which the corresponding quantity is not calculated because the source is not in that specific accretion regime (or is out of scale and thus negligible for the overall luminosity budget; see Sect. 4 for details).
Current usage metrics show cumulative count of Article Views (full-text article views including HTML views, PDF and ePub downloads, according to the available data) and Abstracts Views on Vision4Press platform.
Data correspond to usage on the plateform after 2015. The current usage metrics is available 48-96 hours after online publication and is updated daily on week days.
Initial download of the metrics may take a while.