Fig. 3
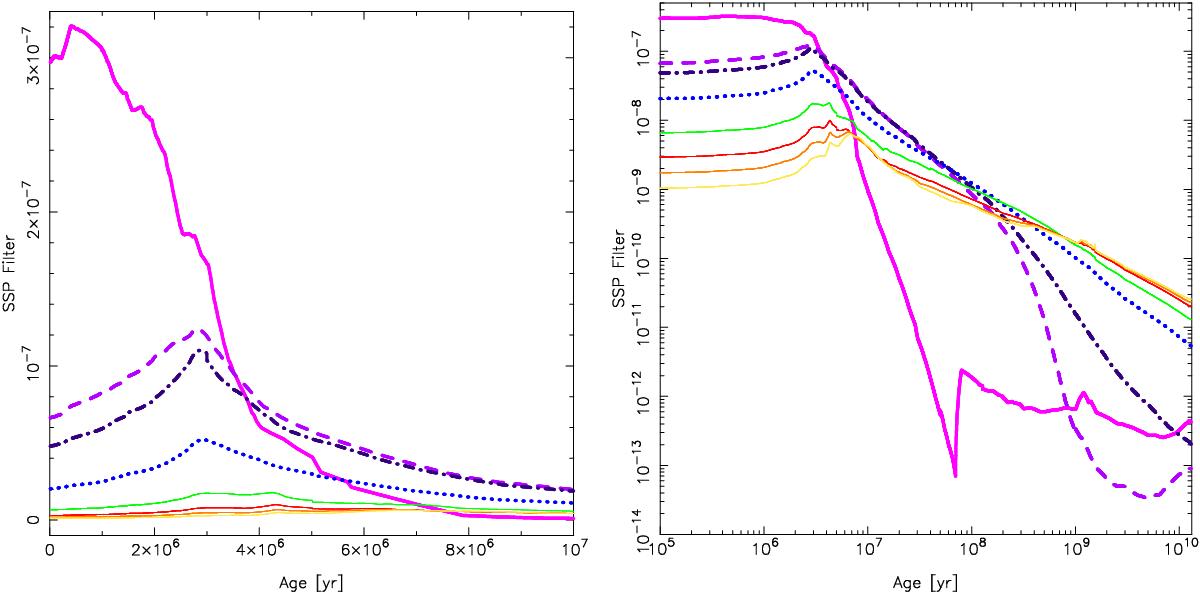
SSP luminosity evolution ℓλ,IMF(t∗) as SFH sensitivity curve (i.e., after normalizing to the integral of the SSP over the age of the system, 13 Gyr in our case). The left panel shows the sensitivity curve on a linear scale from 0 to 107 yr, the right panel the sensitivity curve on a log-log scale for the whole age range. In descending order at young ages the curves correspond to Q(H), galex/FUV and NUV, and sdss/u, g, r, i and z.
Current usage metrics show cumulative count of Article Views (full-text article views including HTML views, PDF and ePub downloads, according to the available data) and Abstracts Views on Vision4Press platform.
Data correspond to usage on the plateform after 2015. The current usage metrics is available 48-96 hours after online publication and is updated daily on week days.
Initial download of the metrics may take a while.