Fig. 2
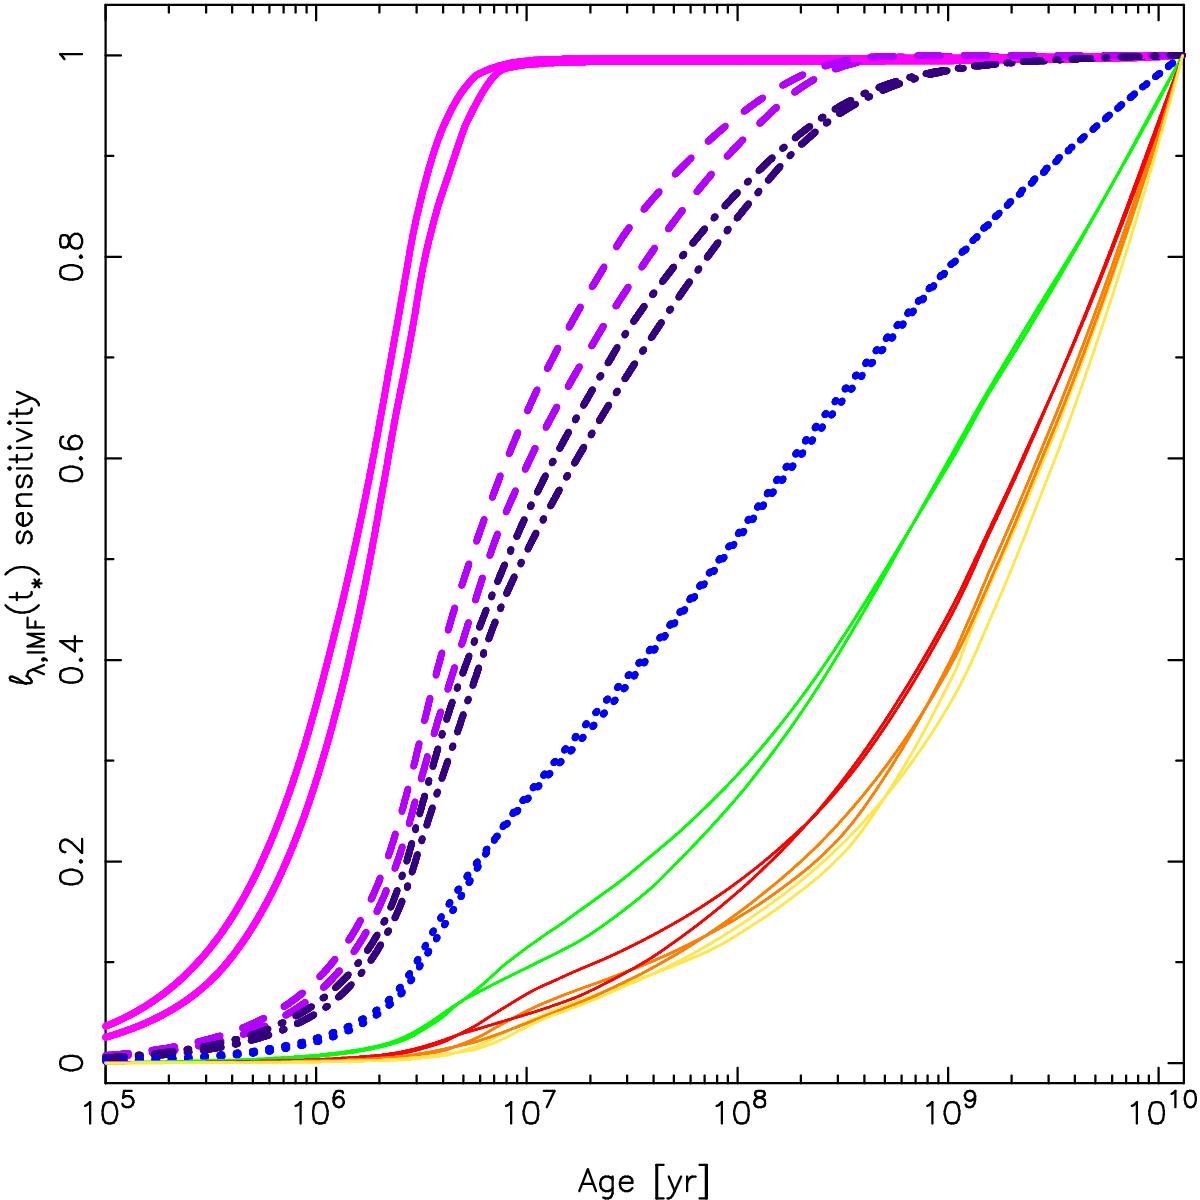
Evolution of the sensitivity of the SSP luminosity ℓλ,IMF(t∗) with age using the upper and lower envelopes of SSP results (see text); the age (or better, age range) corresponding to a given sensibility, tλ,x% can be directly compared with the limits quoted in Table 2 for the different luminosities. In ascending ages each set of two curves corresponds to Q(H), galex/FUV and NUV, and sdss/u, g, r, i and z. These curves can also be interpreted as the evolution of synthesis models under a constant SFR assumption, except for the normalization factor.
Current usage metrics show cumulative count of Article Views (full-text article views including HTML views, PDF and ePub downloads, according to the available data) and Abstracts Views on Vision4Press platform.
Data correspond to usage on the plateform after 2015. The current usage metrics is available 48-96 hours after online publication and is updated daily on week days.
Initial download of the metrics may take a while.