Fig. 1
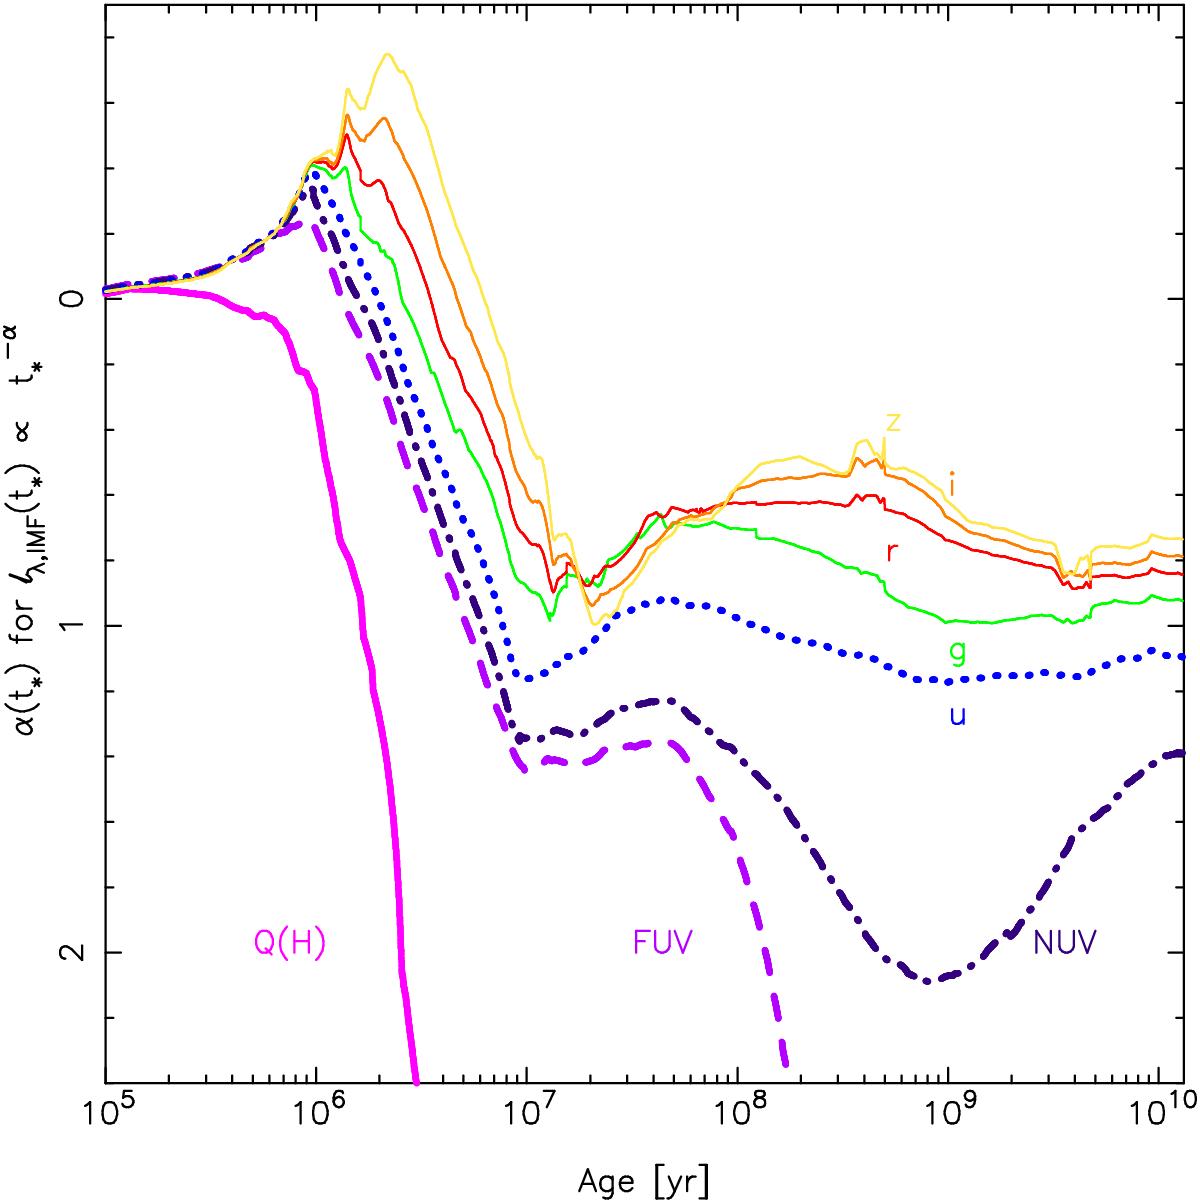
Evolution of the slope of approximating the SSP luminosity following power-law evolution ![]() (α(t∗)) for different photometric bands obtained by combining different synthesis models (see Sect. 3.3 for details). The slope evolution of Q(H) is only shown up to 50 Myr and galex/FUV up to 200 Myr; in addition, the slopes have been smoothed to represent the general aspect of the evolution. We note the non-standard orientation of the y-axis since it refers to α values, whereas the slope is −α.
(α(t∗)) for different photometric bands obtained by combining different synthesis models (see Sect. 3.3 for details). The slope evolution of Q(H) is only shown up to 50 Myr and galex/FUV up to 200 Myr; in addition, the slopes have been smoothed to represent the general aspect of the evolution. We note the non-standard orientation of the y-axis since it refers to α values, whereas the slope is −α.
Current usage metrics show cumulative count of Article Views (full-text article views including HTML views, PDF and ePub downloads, according to the available data) and Abstracts Views on Vision4Press platform.
Data correspond to usage on the plateform after 2015. The current usage metrics is available 48-96 hours after online publication and is updated daily on week days.
Initial download of the metrics may take a while.