Fig. 2
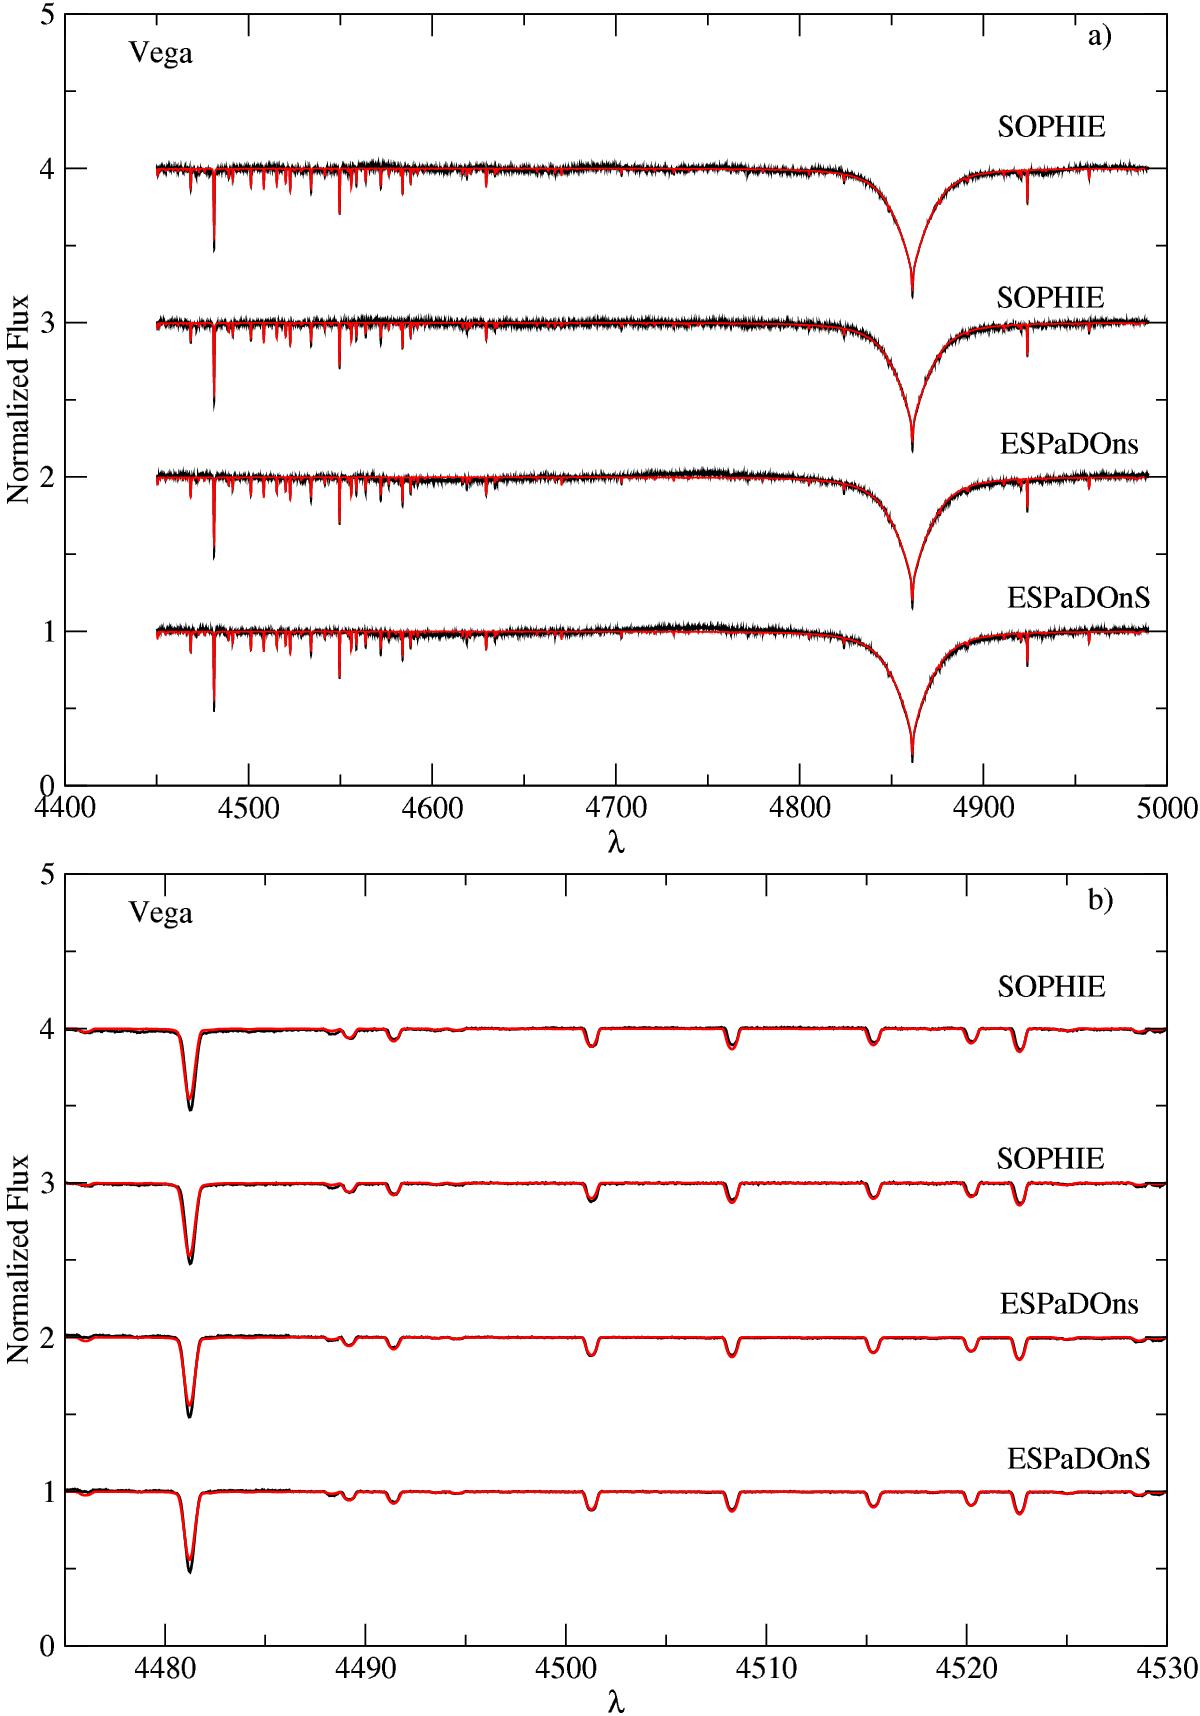
First neighbour fit of synthetic spectra to the observed spectra for the four spectra of Vega, observed at different epochs, retrieved from PolarBase and SOPHIE databases. Observed spectra are shown in black and the synthetic spectra are shown in red. Part a) represents the overall spectrum, whereas part b) indicates the region sensitive to [Fe/H] and vsini. The wavelengths are in Å. Spectra were offset by arbitrary amounts.
Current usage metrics show cumulative count of Article Views (full-text article views including HTML views, PDF and ePub downloads, according to the available data) and Abstracts Views on Vision4Press platform.
Data correspond to usage on the plateform after 2015. The current usage metrics is available 48-96 hours after online publication and is updated daily on week days.
Initial download of the metrics may take a while.