Free Access
Fig. 6
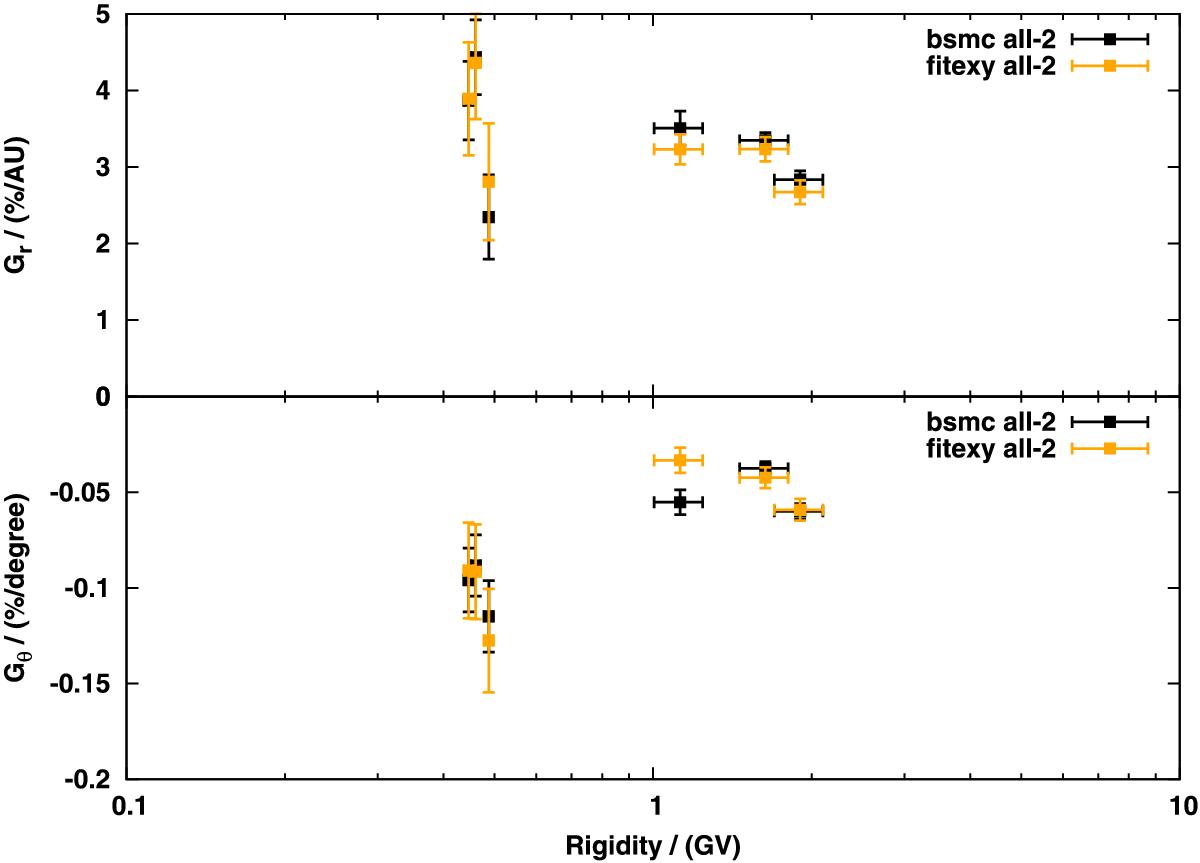
Calculated radial (top) and latitudinal (bottom) gradients for the whole investigation period. Shown are the gradients resulting from the bootstrap Monte Carlo fit approach in black and using the fitexy function in orange. For all three rigidities below 1 GV the same PAMELA channel is used (see Sect. 3.2).
Current usage metrics show cumulative count of Article Views (full-text article views including HTML views, PDF and ePub downloads, according to the available data) and Abstracts Views on Vision4Press platform.
Data correspond to usage on the plateform after 2015. The current usage metrics is available 48-96 hours after online publication and is updated daily on week days.
Initial download of the metrics may take a while.