Fig. 5
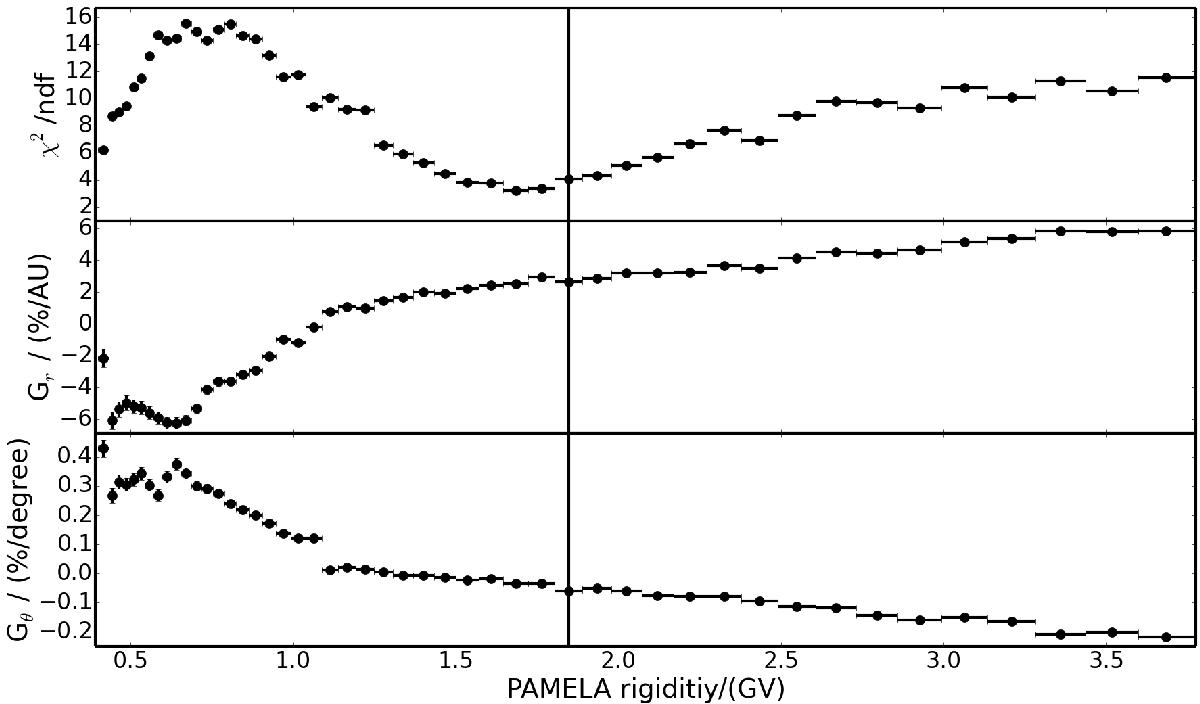
Top: χ2 of the fit to Eq. (8) using the fitexy function for protons measured at Ulysses/KET at ~1.9 GV as a function of PAMELA proton measurements at varying rigidities used in Eq. (8). Middle and bottom: corresponding radial and latitudinal gradients, respectively. The PAMELA rigidity bin closest to the theoretical mean rigidity of Ulysses/KET is indicated with the vertical line.
Current usage metrics show cumulative count of Article Views (full-text article views including HTML views, PDF and ePub downloads, according to the available data) and Abstracts Views on Vision4Press platform.
Data correspond to usage on the plateform after 2015. The current usage metrics is available 48-96 hours after online publication and is updated daily on week days.
Initial download of the metrics may take a while.