Free Access
Fig. 2
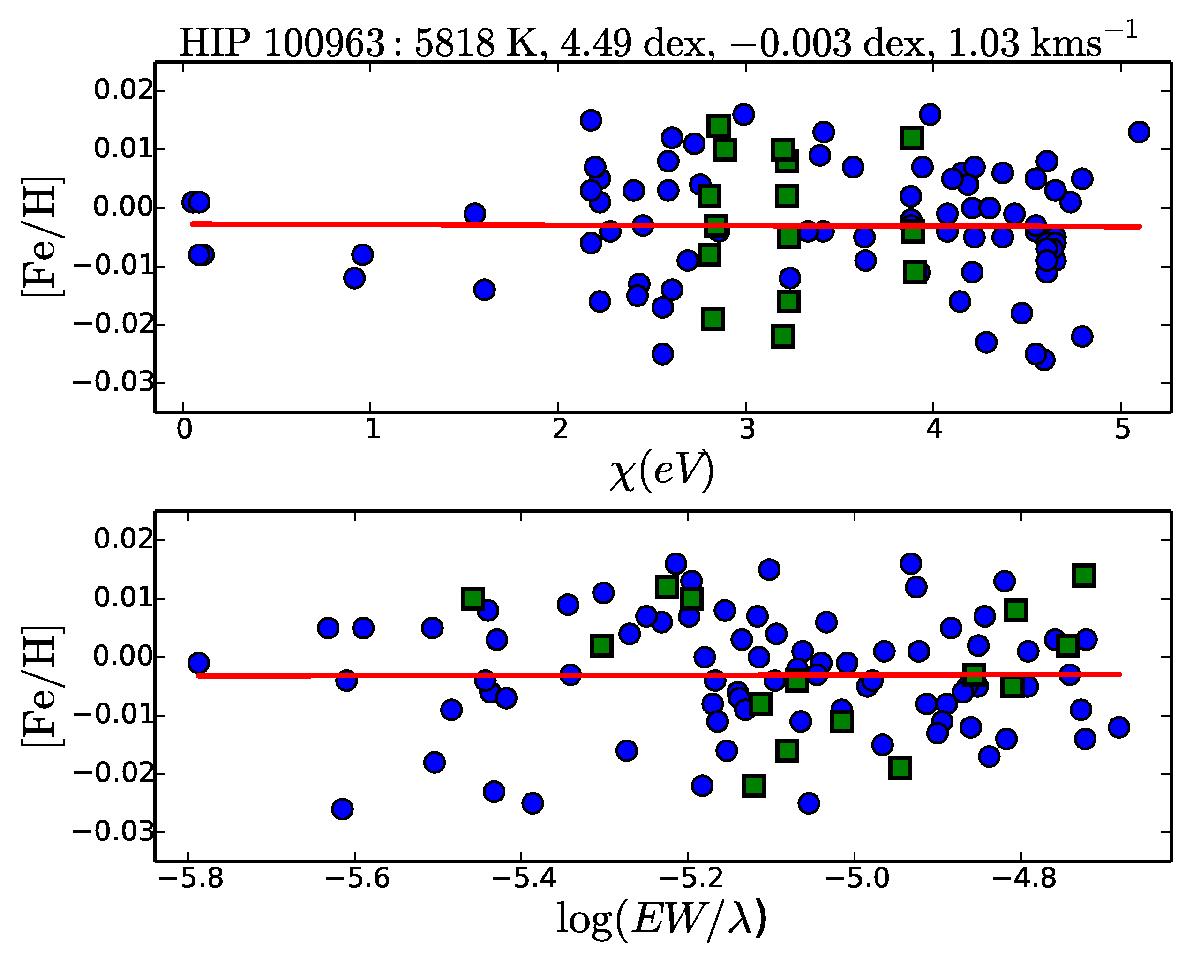
Differential abundance of HIP 100963 relative to the Sun as a function of excitation potential (top panel) and reduced equivalent width (bottom panel). The blue filled circles represent Fe I, the green filled squares Fe II. The red solid lines in both panels are linear fits to Fe I.
Current usage metrics show cumulative count of Article Views (full-text article views including HTML views, PDF and ePub downloads, according to the available data) and Abstracts Views on Vision4Press platform.
Data correspond to usage on the plateform after 2015. The current usage metrics is available 48-96 hours after online publication and is updated daily on week days.
Initial download of the metrics may take a while.