Free Access
Fig. 4

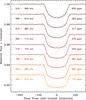
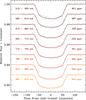
Color light curves of CoRoT-29b. Left and right panels: data from July 31st, 2014 and July 8th 2015, respectively. The light curves are shown after removing the modeled systematics, and overplotted are the best-fitting light-curve models.
This figure is made of several images, please see below:
Current usage metrics show cumulative count of Article Views (full-text article views including HTML views, PDF and ePub downloads, according to the available data) and Abstracts Views on Vision4Press platform.
Data correspond to usage on the plateform after 2015. The current usage metrics is available 48-96 hours after online publication and is updated daily on week days.
Initial download of the metrics may take a while.