Fig. 3
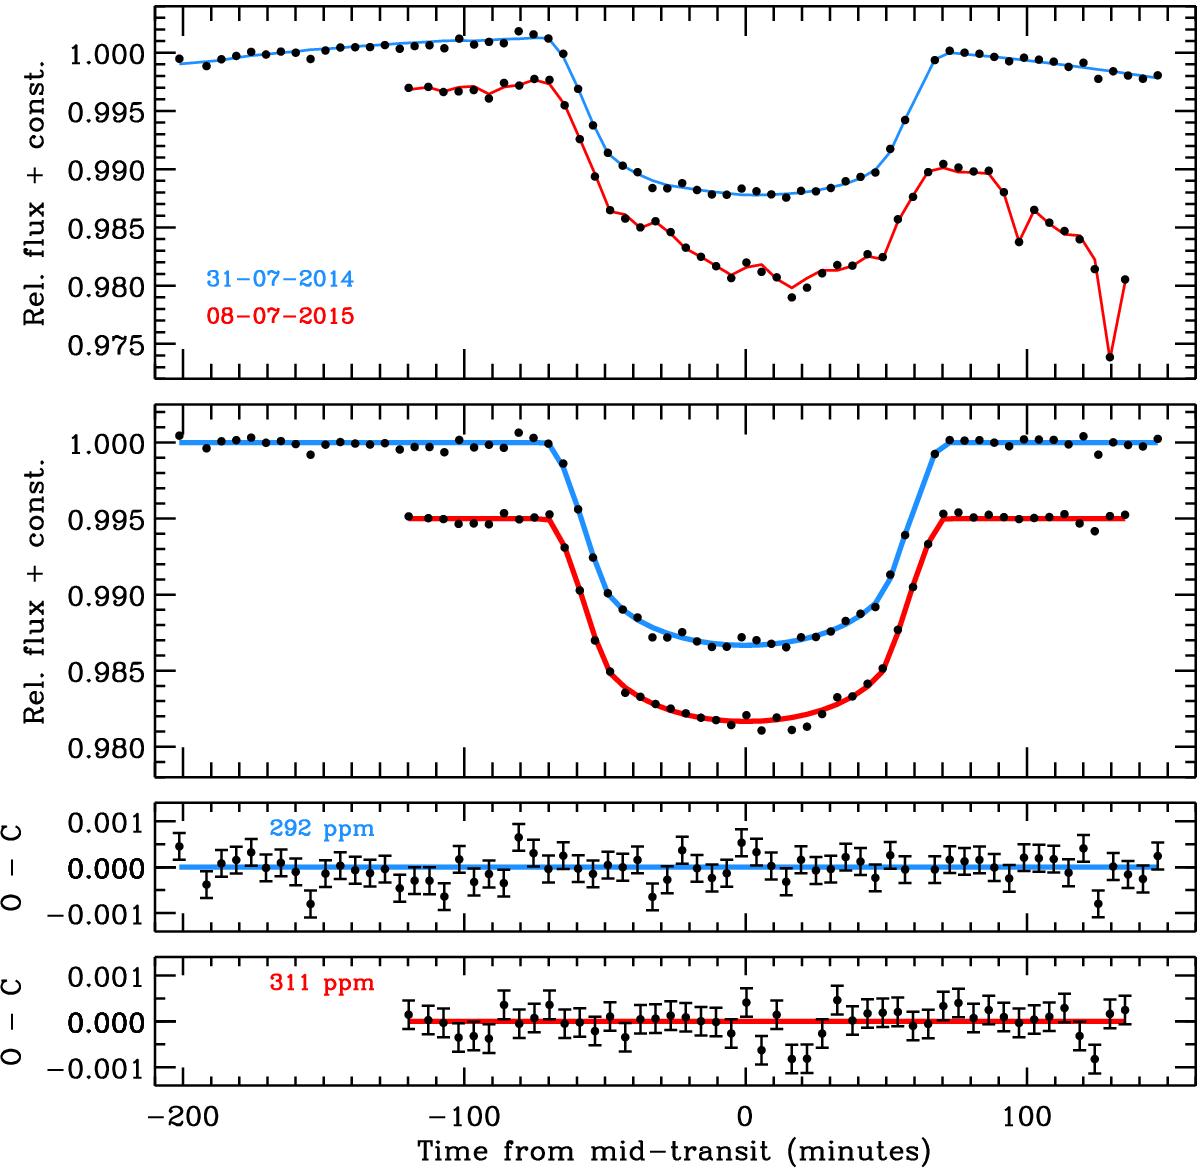
White light curve of CoRoT-29b. It is a summation of all the color-shaded passbands as shown in Fig. 2. From top to bottom: (1) normalized flux ratio between CoRoT-29 and its reference star, together with the best-fitting model; (2) white light curve after removing the modeled systematics, for display purpose; (3, 4) best-fitting light-curve residuals.
Current usage metrics show cumulative count of Article Views (full-text article views including HTML views, PDF and ePub downloads, according to the available data) and Abstracts Views on Vision4Press platform.
Data correspond to usage on the plateform after 2015. The current usage metrics is available 48-96 hours after online publication and is updated daily on week days.
Initial download of the metrics may take a while.