Free Access
Fig. 4
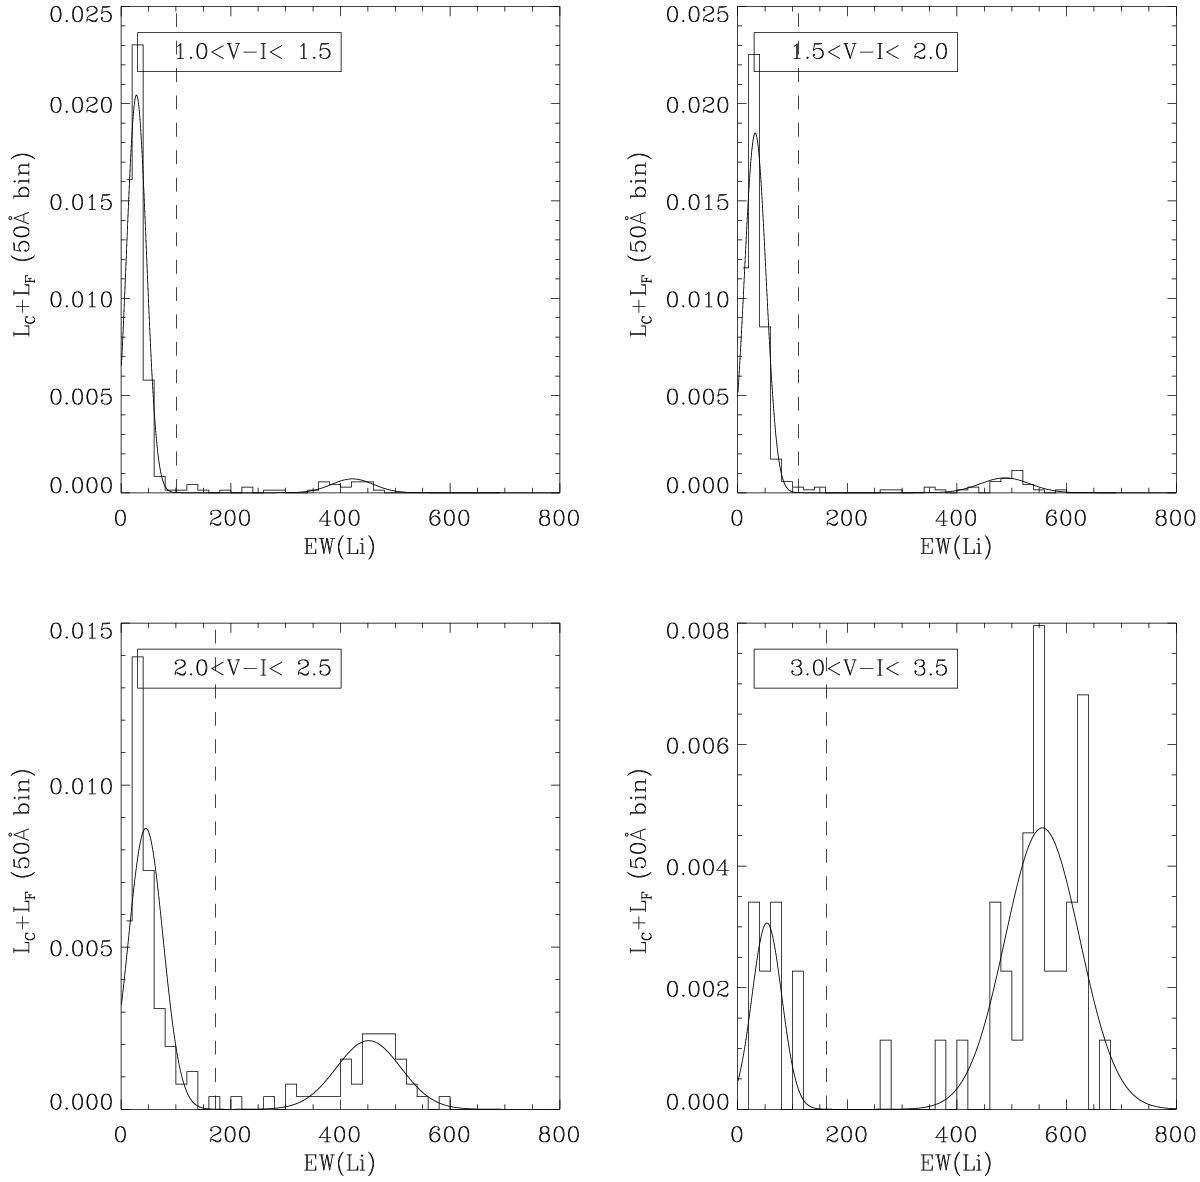
Comparison between the EW(Li) distributions of all observed targets falling in the selected V − I ranges and the best fit models derived as described in the text. The dashed vertical line in each panel indicates the threshold that has been used to select cluster members.
Current usage metrics show cumulative count of Article Views (full-text article views including HTML views, PDF and ePub downloads, according to the available data) and Abstracts Views on Vision4Press platform.
Data correspond to usage on the plateform after 2015. The current usage metrics is available 48-96 hours after online publication and is updated daily on week days.
Initial download of the metrics may take a while.