Fig. 6
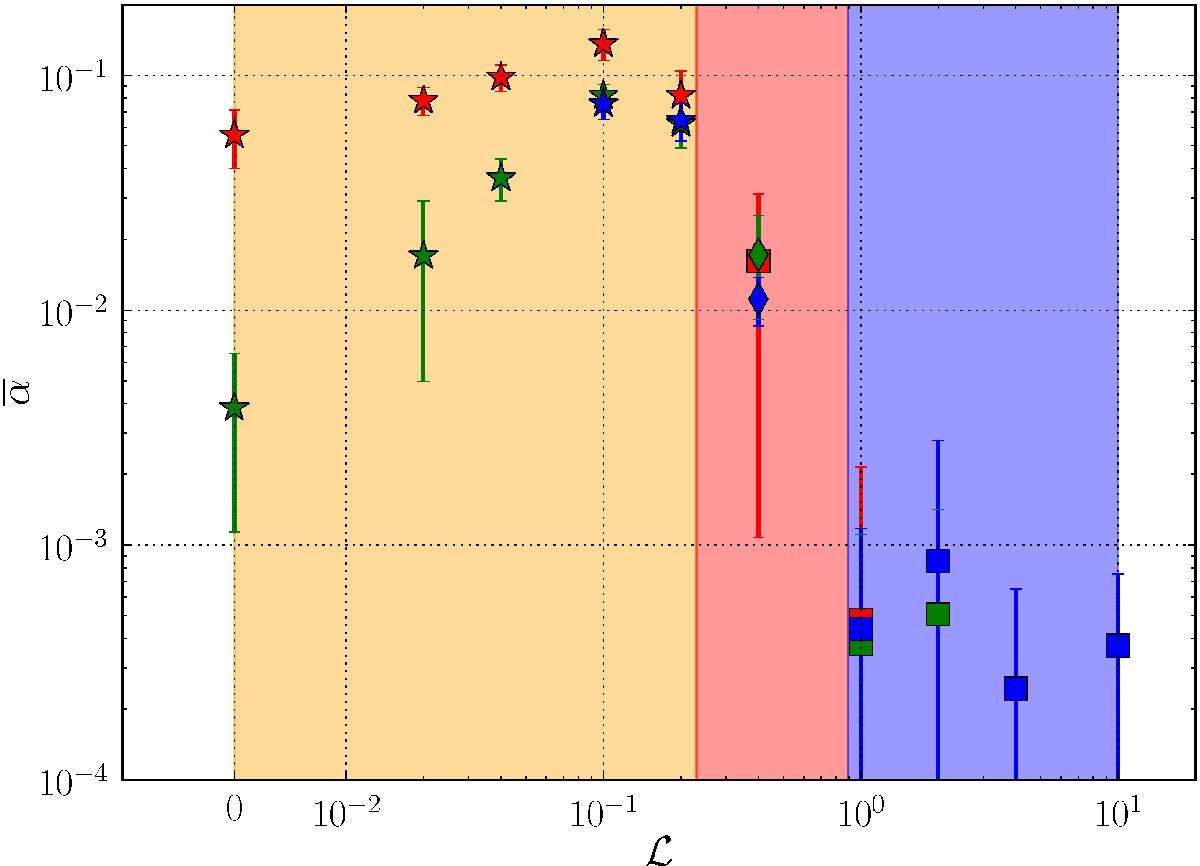
Time-averaged total turbulent stress ![]() as a function of the Hall parameter ℒ for runs B3 (red), B4 (green) and B5 (blue). The bars indicate the standard deviation over the averaging time interval. The final state of the flow is represented by stars for turbulence (filled orange region), diamonds for vortex (filled red region) and squares for zonal flows (filled blue region).
as a function of the Hall parameter ℒ for runs B3 (red), B4 (green) and B5 (blue). The bars indicate the standard deviation over the averaging time interval. The final state of the flow is represented by stars for turbulence (filled orange region), diamonds for vortex (filled red region) and squares for zonal flows (filled blue region).
Current usage metrics show cumulative count of Article Views (full-text article views including HTML views, PDF and ePub downloads, according to the available data) and Abstracts Views on Vision4Press platform.
Data correspond to usage on the plateform after 2015. The current usage metrics is available 48-96 hours after online publication and is updated daily on week days.
Initial download of the metrics may take a while.