Free Access
Fig. 5
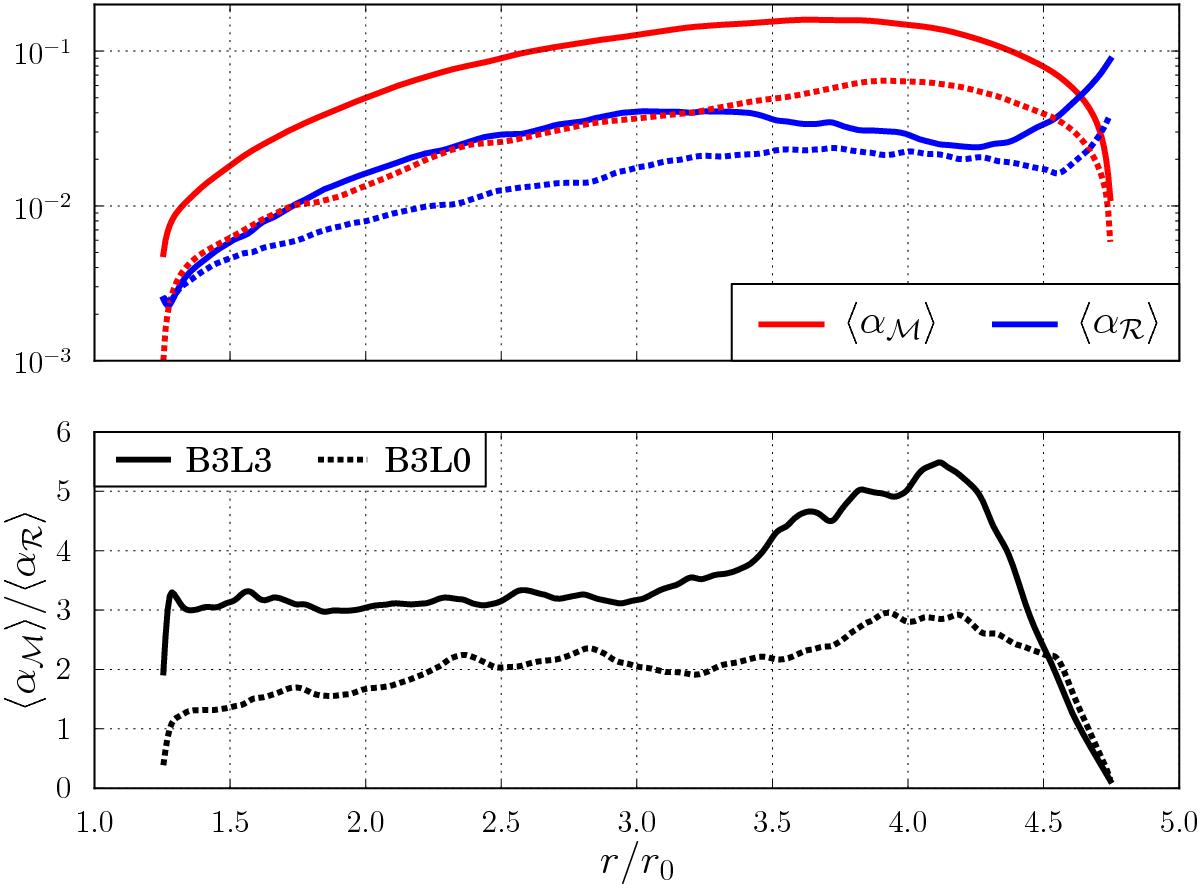
Upper panel: radial profiles of the magnetic (red) and kinetic (blue) contribution to α in runs B3L3 (solid line) and B3L0 (dashed line); lower panel: ratio of Maxwell to Reynolds stress in the same runs. The time averaging is performed between 100T0 and 200T0.
Current usage metrics show cumulative count of Article Views (full-text article views including HTML views, PDF and ePub downloads, according to the available data) and Abstracts Views on Vision4Press platform.
Data correspond to usage on the plateform after 2015. The current usage metrics is available 48-96 hours after online publication and is updated daily on week days.
Initial download of the metrics may take a while.