Free Access
Fig. 15
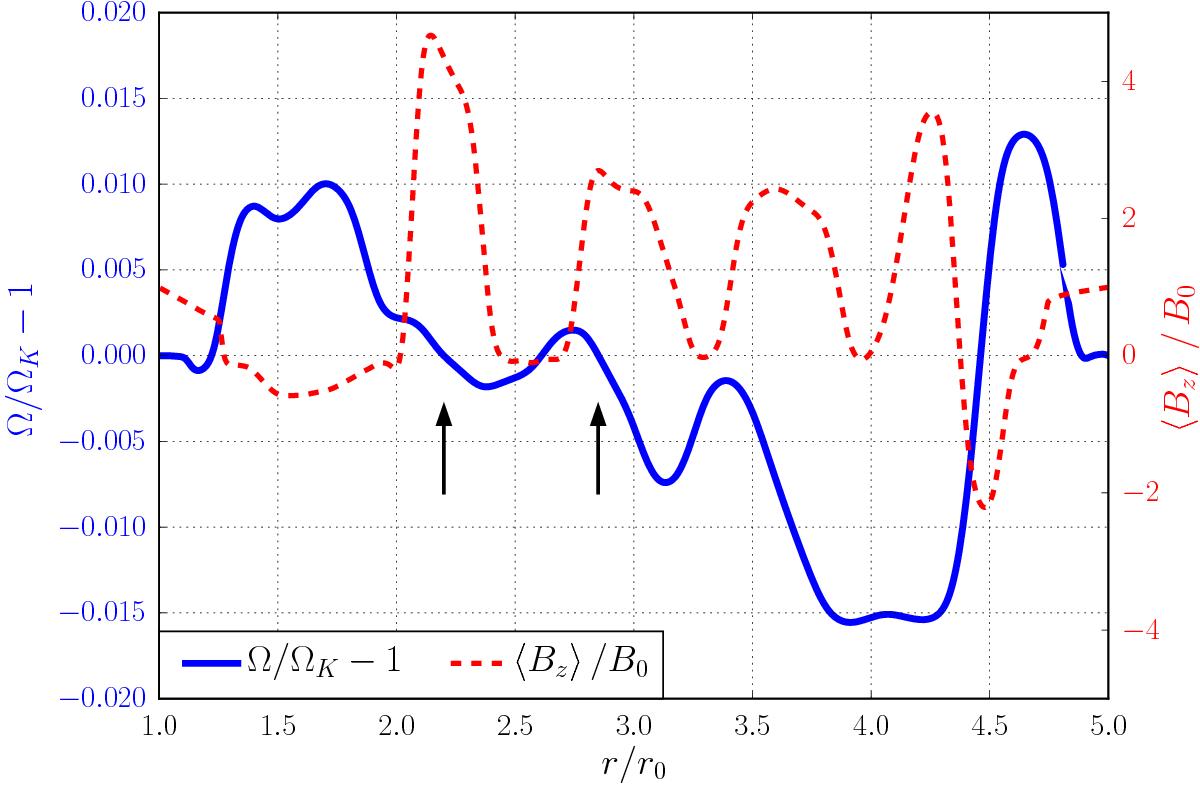
Relative fluctuations of angular velocity (solid blue) and vertical magnetic field (dashed red) in run B3L6, averaged in time between 260T0 and 300T0. The arrows indicate regions of favoured dust accumulation.
Current usage metrics show cumulative count of Article Views (full-text article views including HTML views, PDF and ePub downloads, according to the available data) and Abstracts Views on Vision4Press platform.
Data correspond to usage on the plateform after 2015. The current usage metrics is available 48-96 hours after online publication and is updated daily on week days.
Initial download of the metrics may take a while.