Fig. 3
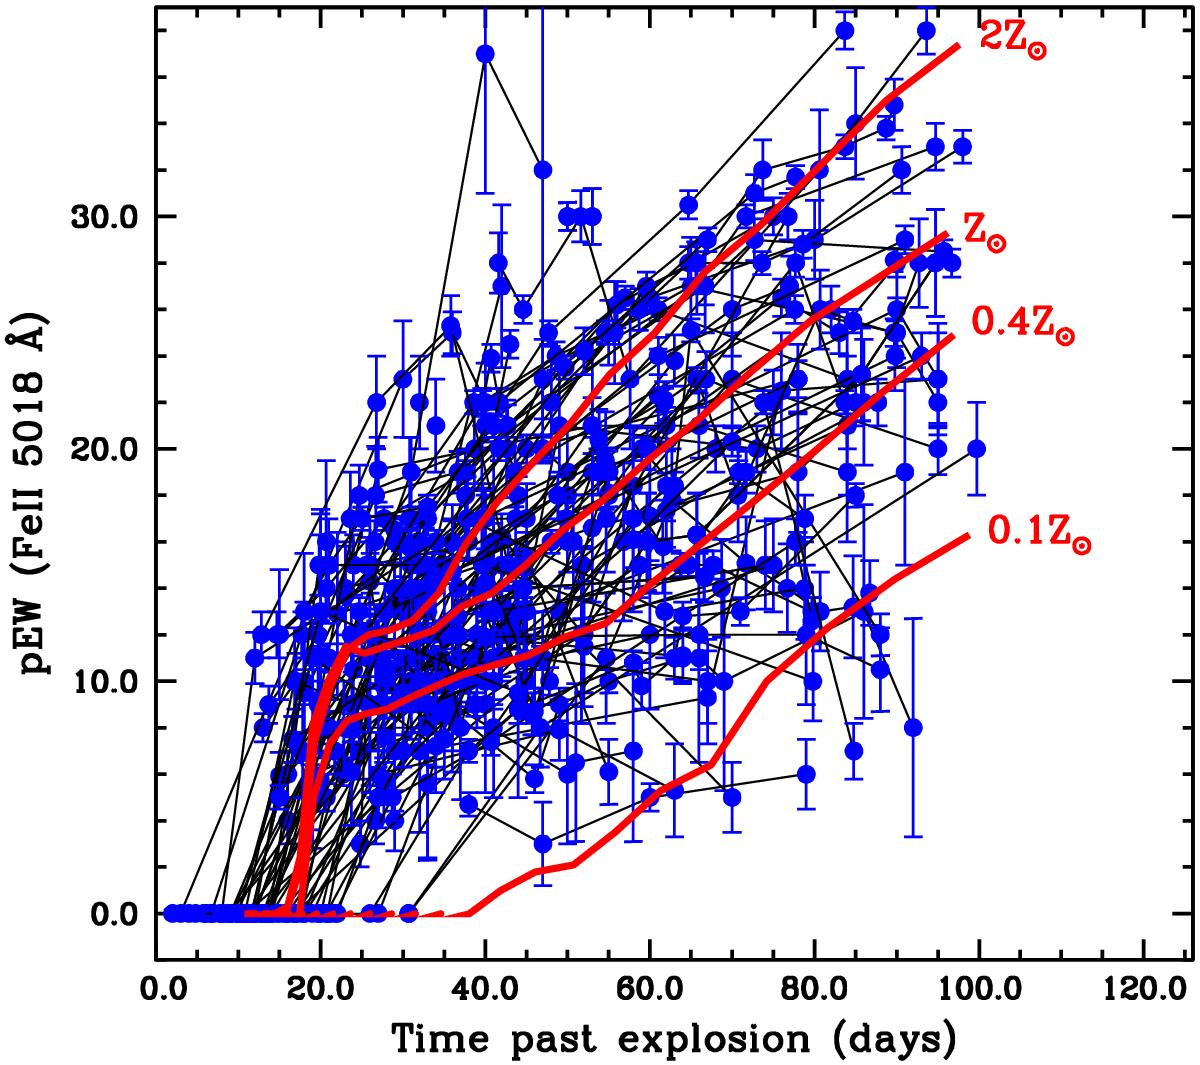
Evolution of Fe ii 5018 Å pEWs with time for all SNe II within the sample. Individual measurements are shown in blue, together with their errors. These are connected by black lines. Also presented are the time sequence of pEWs measured from synthetic spectra (Dessart et al. 2013), for four models of distinct progenitor metallicity.
Current usage metrics show cumulative count of Article Views (full-text article views including HTML views, PDF and ePub downloads, according to the available data) and Abstracts Views on Vision4Press platform.
Data correspond to usage on the plateform after 2015. The current usage metrics is available 48-96 hours after online publication and is updated daily on week days.
Initial download of the metrics may take a while.