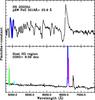
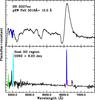
Fig. 2

Two examples of both SN II spectra (upper panels, at epochs close to 50 days post explosion) and host H ii-region spectra (lower panels). Left: SN 2003bl, a SN with relatively high Fe ii 5018 Å pEW and O3N2 abundance, and right: SN 2007oc with relatively low Fe ii 5018 Å pEW and O3N2 abundance. The position of the Fe ii 5018 Å absorption feature in the SN spectra is indicated in blue. In the H ii-region spectra we indicate the position of the emission lines used for abundance estimations: Hβ in green, [O iii] in cyan, Hα in blue, and [N ii] in magenta.
Current usage metrics show cumulative count of Article Views (full-text article views including HTML views, PDF and ePub downloads, according to the available data) and Abstracts Views on Vision4Press platform.
Data correspond to usage on the plateform after 2015. The current usage metrics is available 48-96 hours after online publication and is updated daily on week days.
Initial download of the metrics may take a while.