Fig. 8
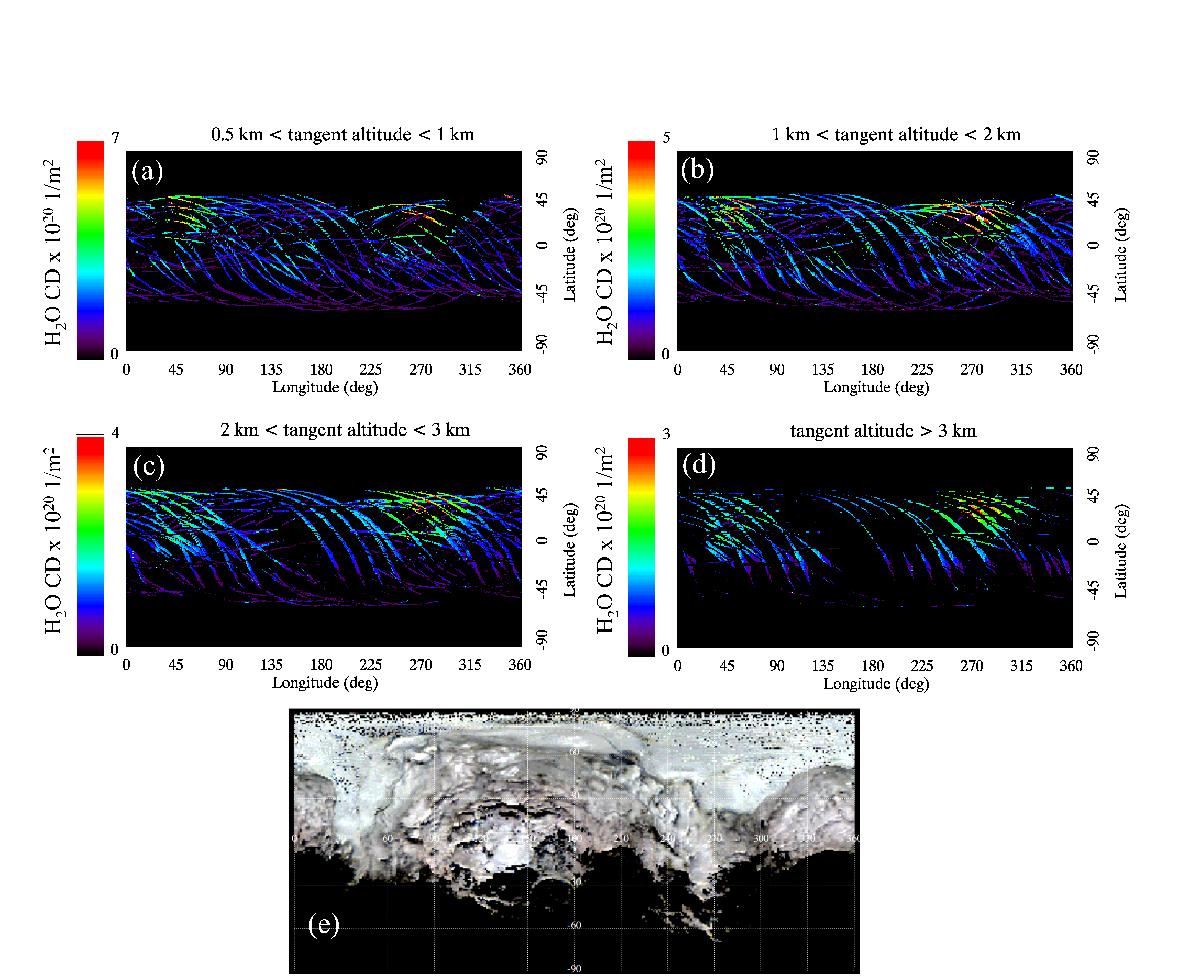
a) Cylindrical map of the H2O column density for data with a tangent altitude between 0.5 km and 1 km at any LST. VIRTIS-M pixels are identified on the surface by means of the position of the tangent point. Points having a column density exceeding the maximum value indicated by the colour ramp are marked in white. b) to d) The same map distribution for 1 ≤ tangent altitude ≤ 2.0 km, 2.0 ≤ tangent altitude ≤ 3.0 km and for tangent altitude ≥3.0 km is shown. e) True colour albedo map from Ciarniello et al. (2015), as a reference.
Current usage metrics show cumulative count of Article Views (full-text article views including HTML views, PDF and ePub downloads, according to the available data) and Abstracts Views on Vision4Press platform.
Data correspond to usage on the plateform after 2015. The current usage metrics is available 48-96 hours after online publication and is updated daily on week days.
Initial download of the metrics may take a while.