Open Access
Fig. 7
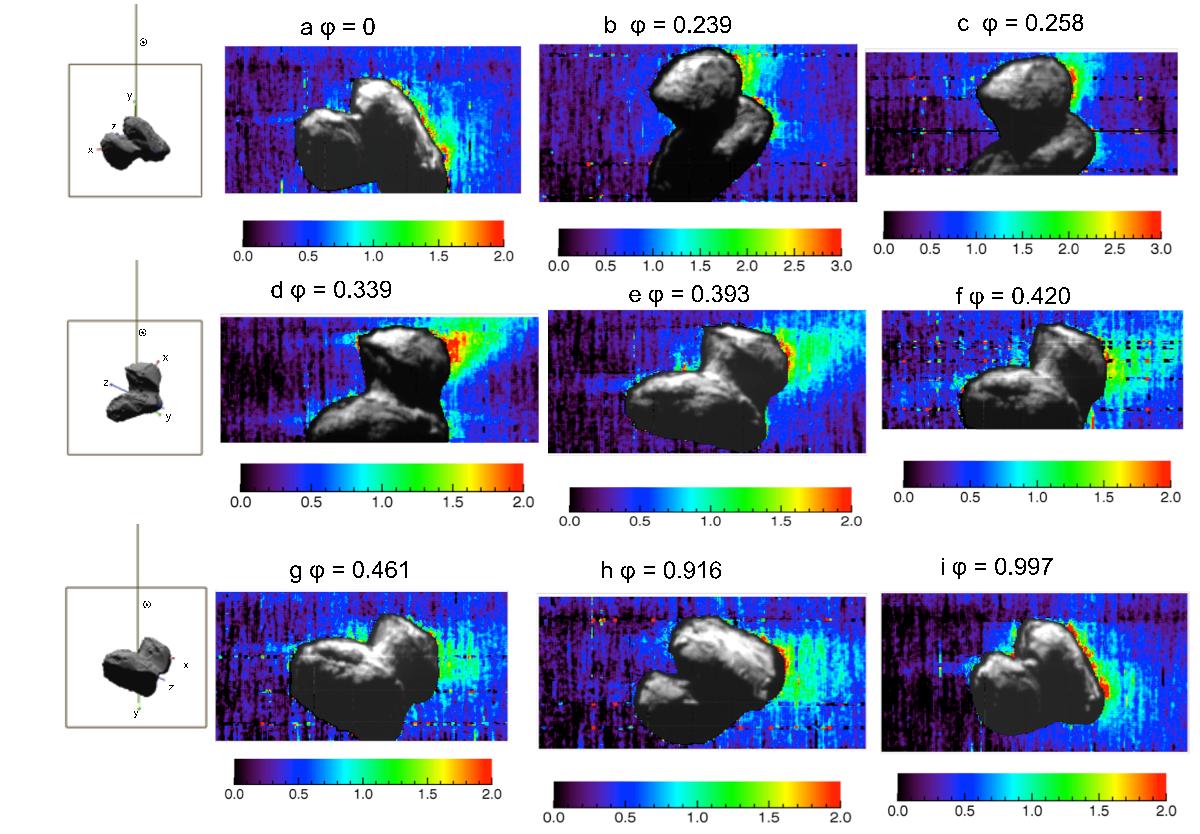
As in Fig. 6, showing the CO2 column density for a sequence of nine VIRTIS-M images. The CO2 outgassing mostly occurs in the head of the comet, while in some cases it is more concentrated in the southern regions. Intensities are provided in terms of 1019 molecules m-2.
Current usage metrics show cumulative count of Article Views (full-text article views including HTML views, PDF and ePub downloads, according to the available data) and Abstracts Views on Vision4Press platform.
Data correspond to usage on the plateform after 2015. The current usage metrics is available 48-96 hours after online publication and is updated daily on week days.
Initial download of the metrics may take a while.