Fig. 6
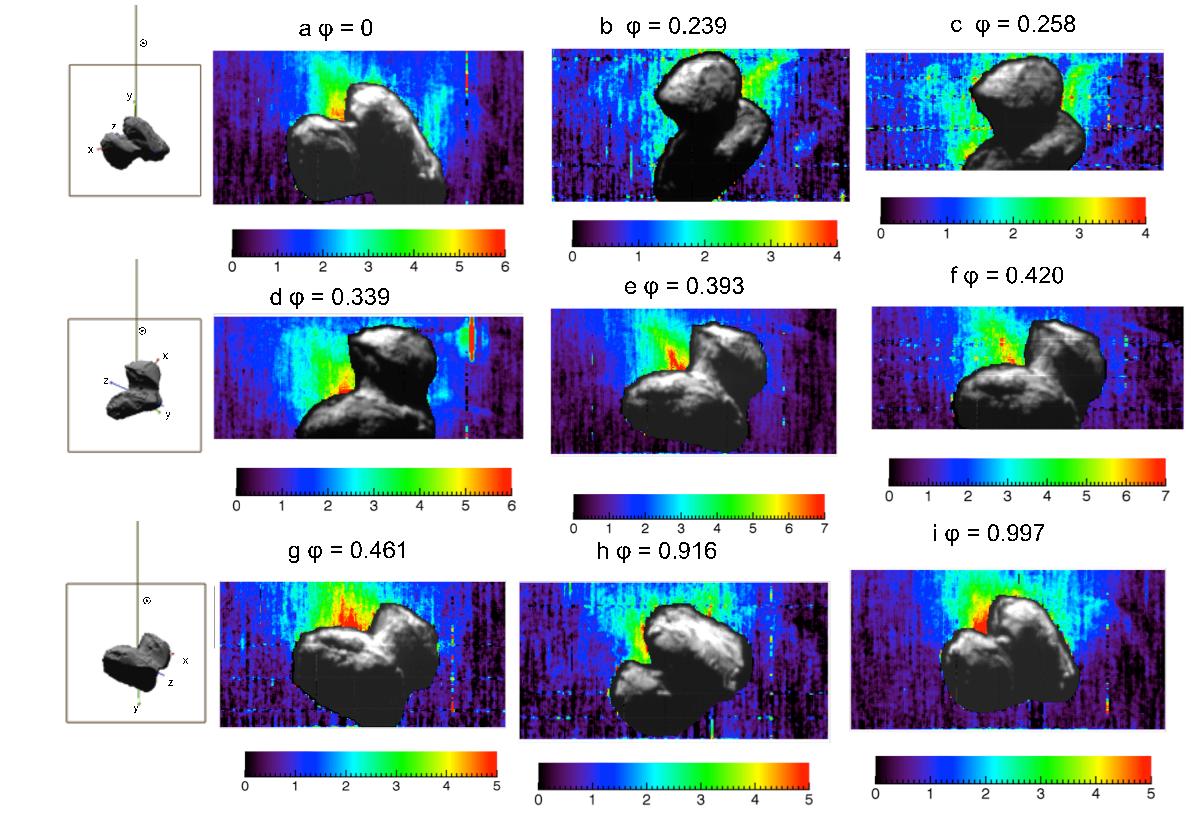
H2O column density retrieved on nine VIRTIS-M images, acquired from 11 to 13 April 2015 at rotational phases φ. Image details are provided in Table A.1, as identified with the italic character. In the images a), h), i), emissions are located in the southern hemisphere. Intensities are provided in terms of 1020 molecules m-2. The simulation on the left with respect to the water maps shows the comet’s x,y,z axes, and the Sun direction for the images a), d), and g). The square is the full (3.6° × 3.6°) VIRTIS-M field of view. It corresponds to the images horizontal width, while the vertical size depends on the number of consecutive lines acquired for each image.
Current usage metrics show cumulative count of Article Views (full-text article views including HTML views, PDF and ePub downloads, according to the available data) and Abstracts Views on Vision4Press platform.
Data correspond to usage on the plateform after 2015. The current usage metrics is available 48-96 hours after online publication and is updated daily on week days.
Initial download of the metrics may take a while.