Fig. 4
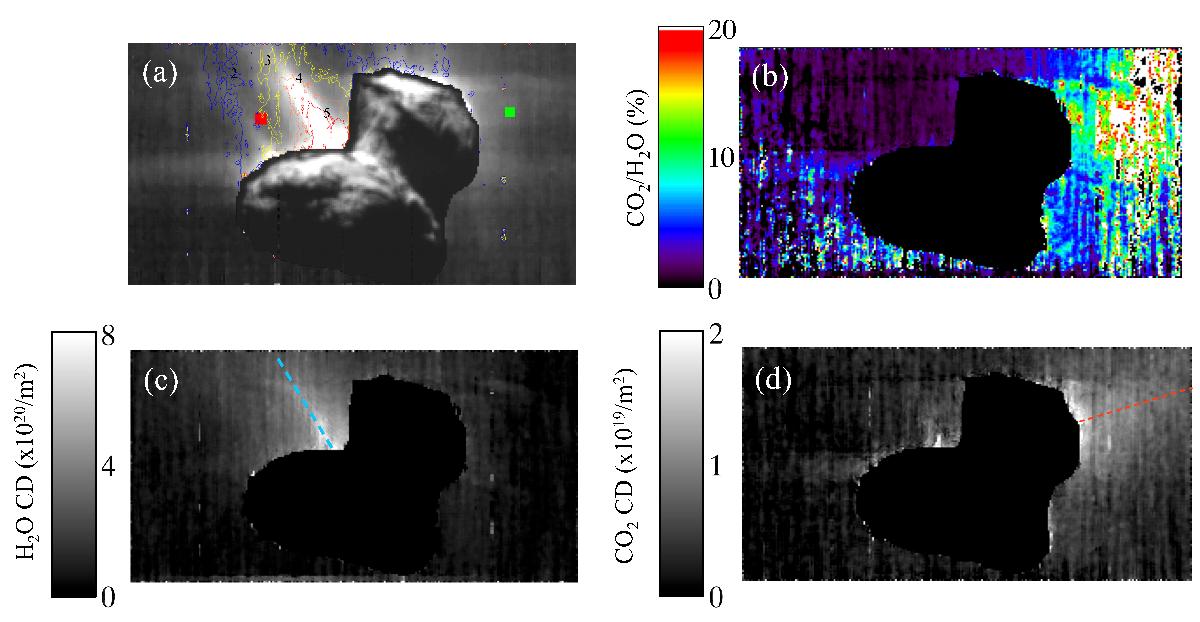
a) Composite image showing the comet’s nucleus at 1.095 μm, and the water column density superimposed. Contour lines in the coma indicate the retrieved H2O column density values ranging from 2 × 10²⁰ m-2 (blue line) to 5 × 10²⁰ m-2 (red line). The image number is I1_00387442903, acquired on 12 April 2015, and shown in Fig. 6e. The observed jets are caused by dust particles, while water is exclusively located in the coma above the neck, as shown in Panel c). The red and green boxes indicate the pixels averaged to provide the mean spectra seen in Fig. 2a, b, respectively. b) CO2 to H2O ratio for the considered VIRTIS image. c) Water column density of the VIRTIS image, obtained as explained in the text. The dashed line indicates the radial direction considered for the profiles in Fig. 5a. d) CO2 column density of the VIRTIS image, obtained as explained in the text. The dashed line indicates the radial profile considered for the profiles in Fig. 5b.
Current usage metrics show cumulative count of Article Views (full-text article views including HTML views, PDF and ePub downloads, according to the available data) and Abstracts Views on Vision4Press platform.
Data correspond to usage on the plateform after 2015. The current usage metrics is available 48-96 hours after online publication and is updated daily on week days.
Initial download of the metrics may take a while.