Fig. 3
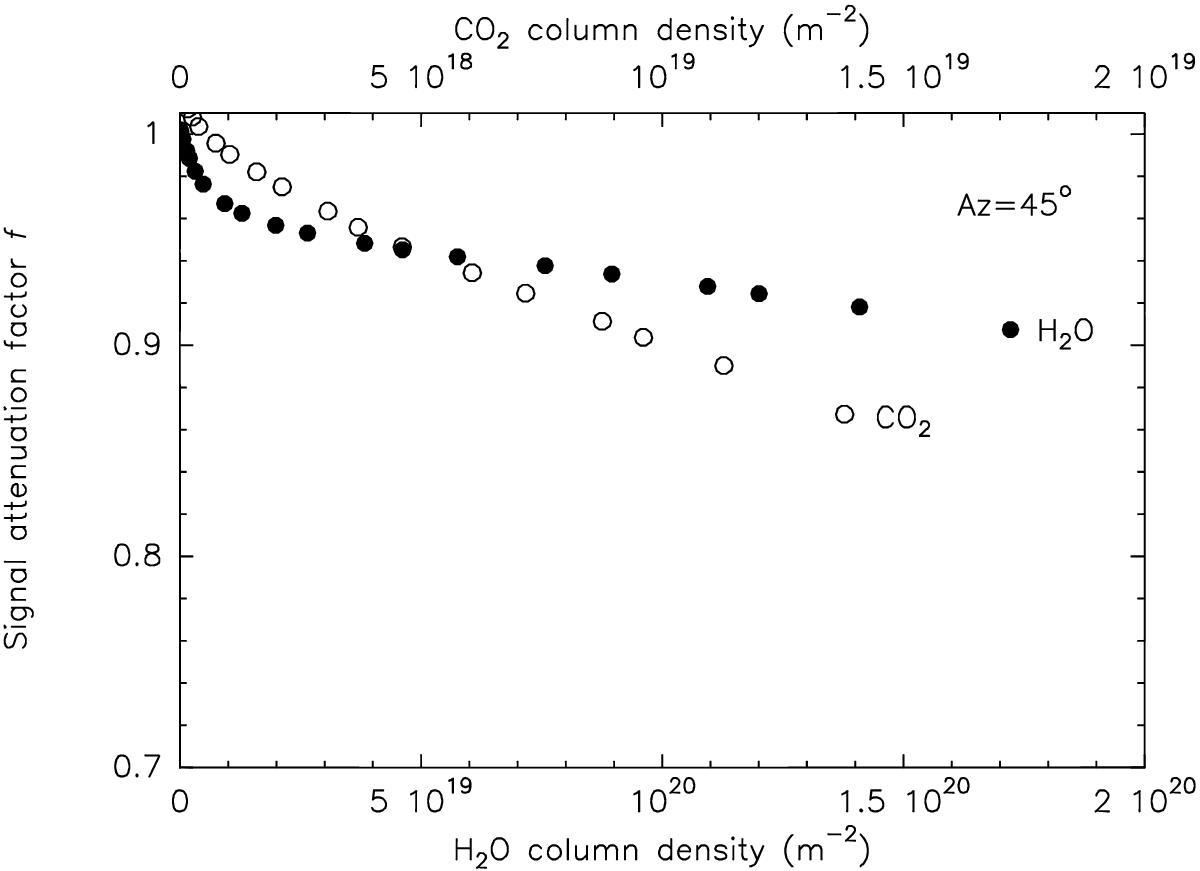
Signal attenuation ratio (f) as a function of column density from the calculations of Debout et al. (2016). Plain symbols are for the H2O ν3 band, with the column density scale given in the bottom x-axis. Open symbols are for the CO2ν3 band, with the column density scale given in the top x-axis. Calculations correspond to an azimut of 45°, a phase angle of 90°, a heliocentric distance of 2 AU, and isotropic gas production with total H2O and CO2 production rates of 1027 and 8 × 1025 s-1, respectively. The highest column densities correspond to altitudes of 0.2, 0.5, 0.8, 1.0, 1.50, 2.0, 3.0 km, with the column density decreasing with increasing altitude.
Current usage metrics show cumulative count of Article Views (full-text article views including HTML views, PDF and ePub downloads, according to the available data) and Abstracts Views on Vision4Press platform.
Data correspond to usage on the plateform after 2015. The current usage metrics is available 48-96 hours after online publication and is updated daily on week days.
Initial download of the metrics may take a while.