Fig. 10
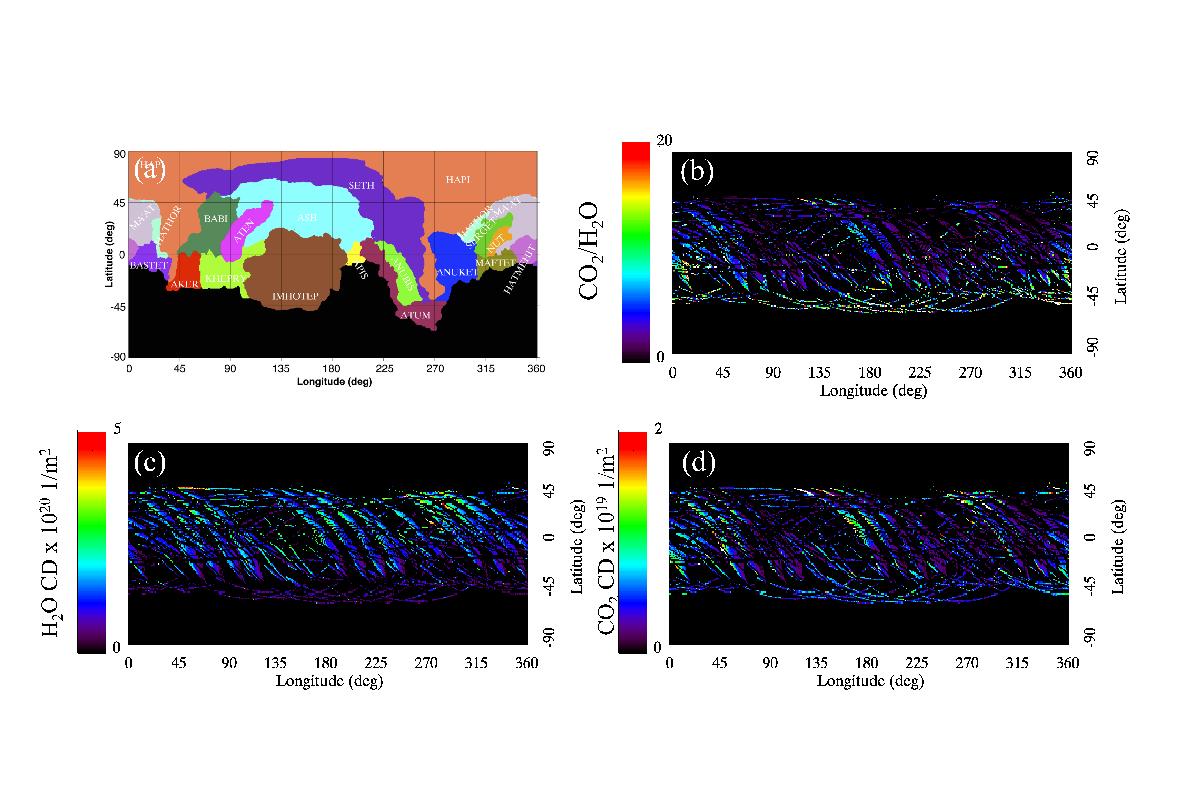
a) Map of the comet’s regions, identified on the surface as reported by Thomas et al. (2015). b) Cylindrical map of CO2 to H2O column density ratio, obtained using the data from the surface to 6 km from the nucleus. The values are provided as the percentage of the CO2 content with respect to the H2O one. Points having a CO2/H2O column density ratio exceeding the maximum value indicated by the colour ramp are marked in white. c) H2O column density map obtained considering the data at a tangent altitude in the range 0 to 6 km from the nucleus. d) The same as c), for CO2.
Current usage metrics show cumulative count of Article Views (full-text article views including HTML views, PDF and ePub downloads, according to the available data) and Abstracts Views on Vision4Press platform.
Data correspond to usage on the plateform after 2015. The current usage metrics is available 48-96 hours after online publication and is updated daily on week days.
Initial download of the metrics may take a while.