Free Access
Fig. 7
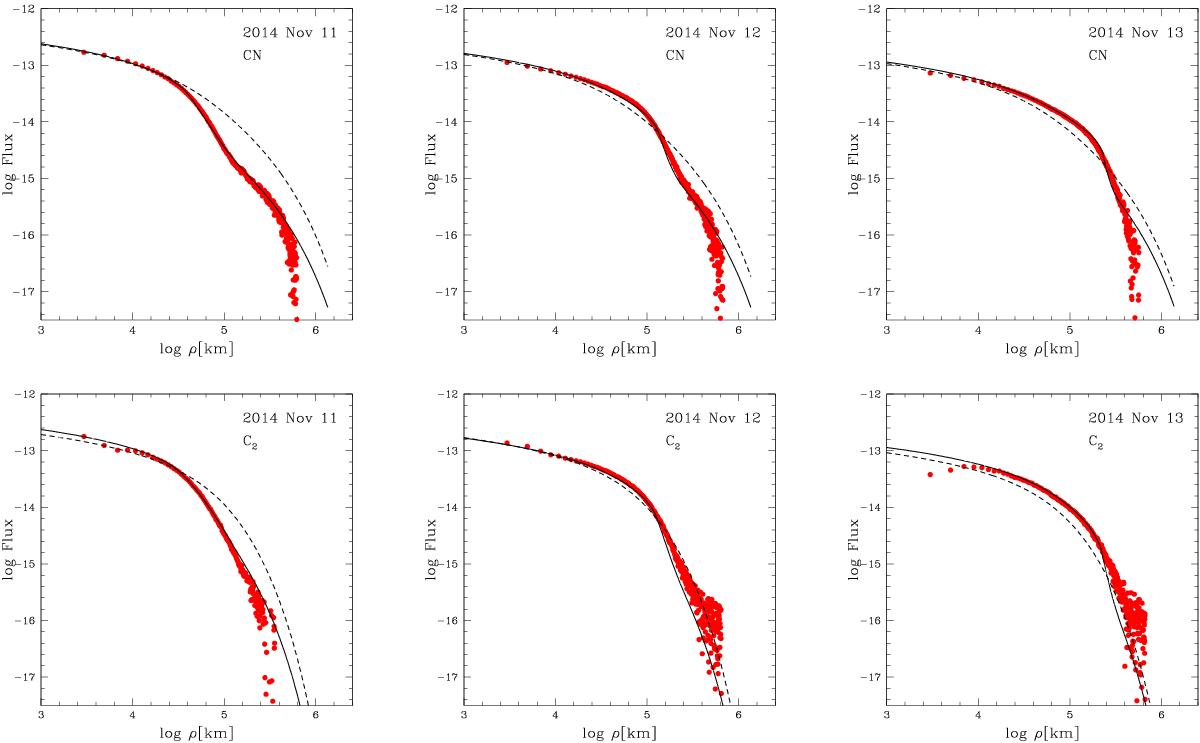
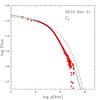
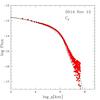
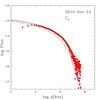
CN (top) and C2 (bottom) brightness profiles from November 11, 12, and 13, 2014 (r = 1.4 au). The observed profiles are represented with red dots, the Haser model is represented by the dashed line and the outburst model is represented by the black line.
This figure is made of several images, please see below:
Current usage metrics show cumulative count of Article Views (full-text article views including HTML views, PDF and ePub downloads, according to the available data) and Abstracts Views on Vision4Press platform.
Data correspond to usage on the plateform after 2015. The current usage metrics is available 48-96 hours after online publication and is updated daily on week days.
Initial download of the metrics may take a while.