Fig. 6
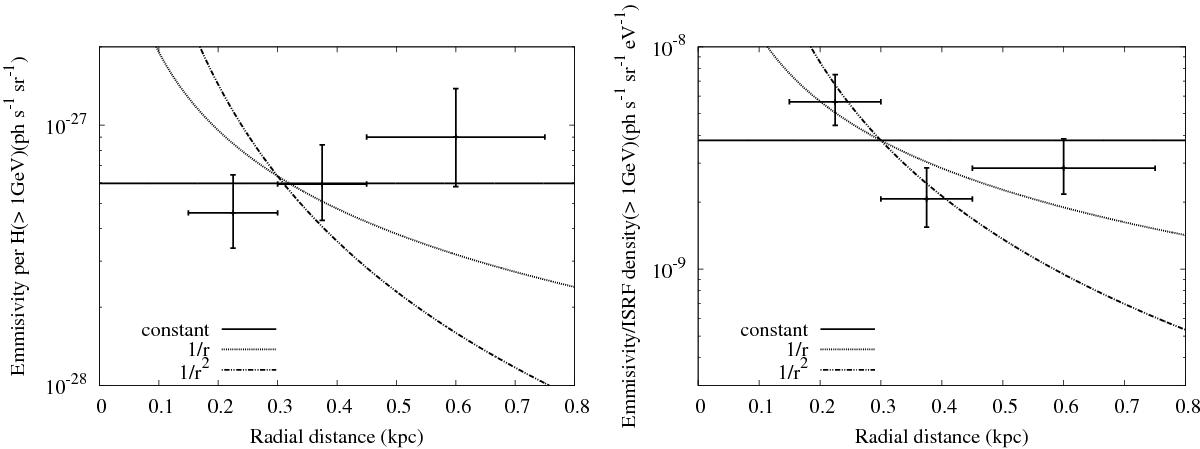
Radial profiles of the γ-ray emissivity for the southern parts of the excess. For comparison, we show the constant (solid curves), 1 /r (dotted curves), and 1 /r2 (dot-dashed curves) profiles, which are predicted by the impulsive injection, continuous injection, and the transport through wind, respectively. Left panel: emissivity per hydrogen atom related to interactions with gas (i.e. inelastic interactions of protons and ions or bremsstrahlung of electrons). Right panel: γ-ray emissivity due to IC normalized to the density of ISRF 1 eV/cm3.
Current usage metrics show cumulative count of Article Views (full-text article views including HTML views, PDF and ePub downloads, according to the available data) and Abstracts Views on Vision4Press platform.
Data correspond to usage on the plateform after 2015. The current usage metrics is available 48-96 hours after online publication and is updated daily on week days.
Initial download of the metrics may take a while.