Fig. 5
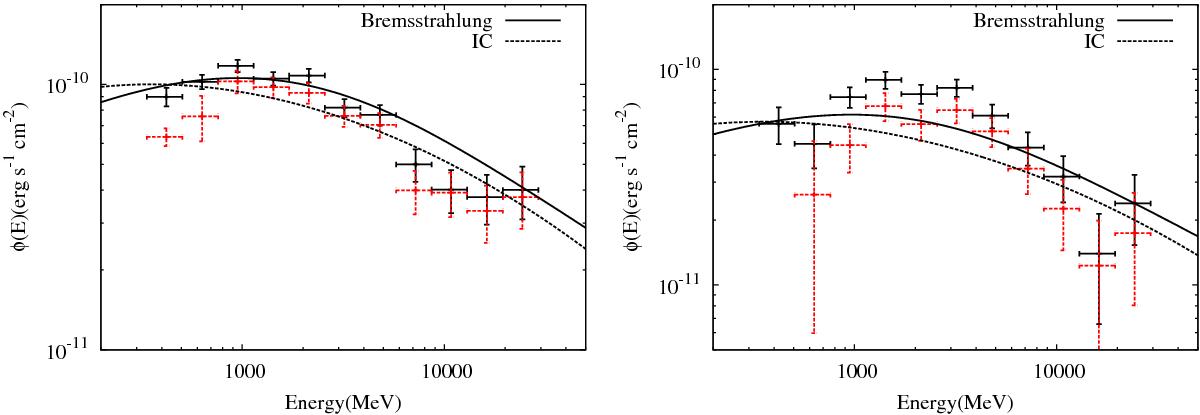
Best fit spectra for the northern (left panel) and southern (right panel) parts of the excess by interactions of electrons through the electron bremsstrahlung (solid curves) and the IC channels (dotted curves). The red and black data points are the same as in Fig. 2. The curves for bremsstrahlung and ICs are normalized so as to explain the measurements separately (for details see the text).
Current usage metrics show cumulative count of Article Views (full-text article views including HTML views, PDF and ePub downloads, according to the available data) and Abstracts Views on Vision4Press platform.
Data correspond to usage on the plateform after 2015. The current usage metrics is available 48-96 hours after online publication and is updated daily on week days.
Initial download of the metrics may take a while.