Free Access
Fig. 4
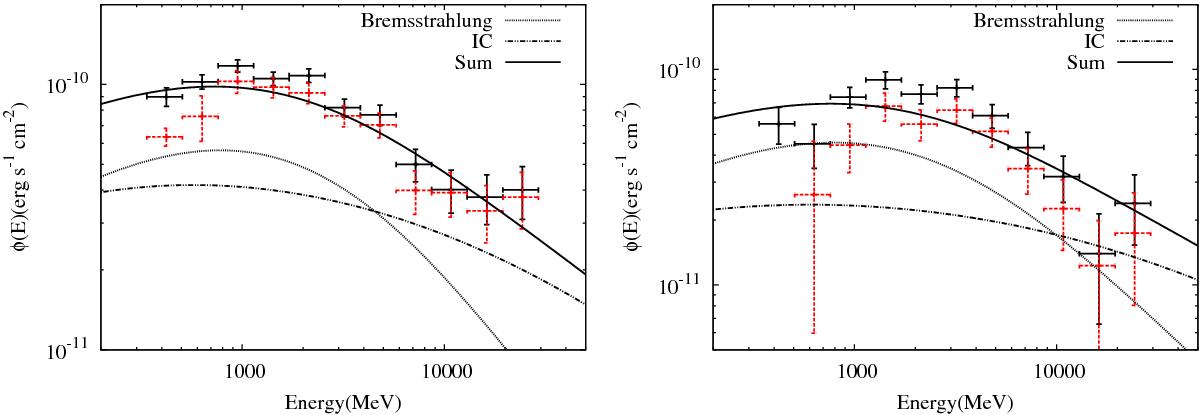
Best fit spectra of leptonic γ-rays for the northern (left panel) and southern (right panel) parts of the excess. The red and black data points are the same as in Fig. 2. The dotted curves represent the contribution from bremsstrahlung, the dot-dashed line represent ICs, and the solid curves are the summations.
This figure is made of several images, please see below:
Current usage metrics show cumulative count of Article Views (full-text article views including HTML views, PDF and ePub downloads, according to the available data) and Abstracts Views on Vision4Press platform.
Data correspond to usage on the plateform after 2015. The current usage metrics is available 48-96 hours after online publication and is updated daily on week days.
Initial download of the metrics may take a while.