Fig. 9
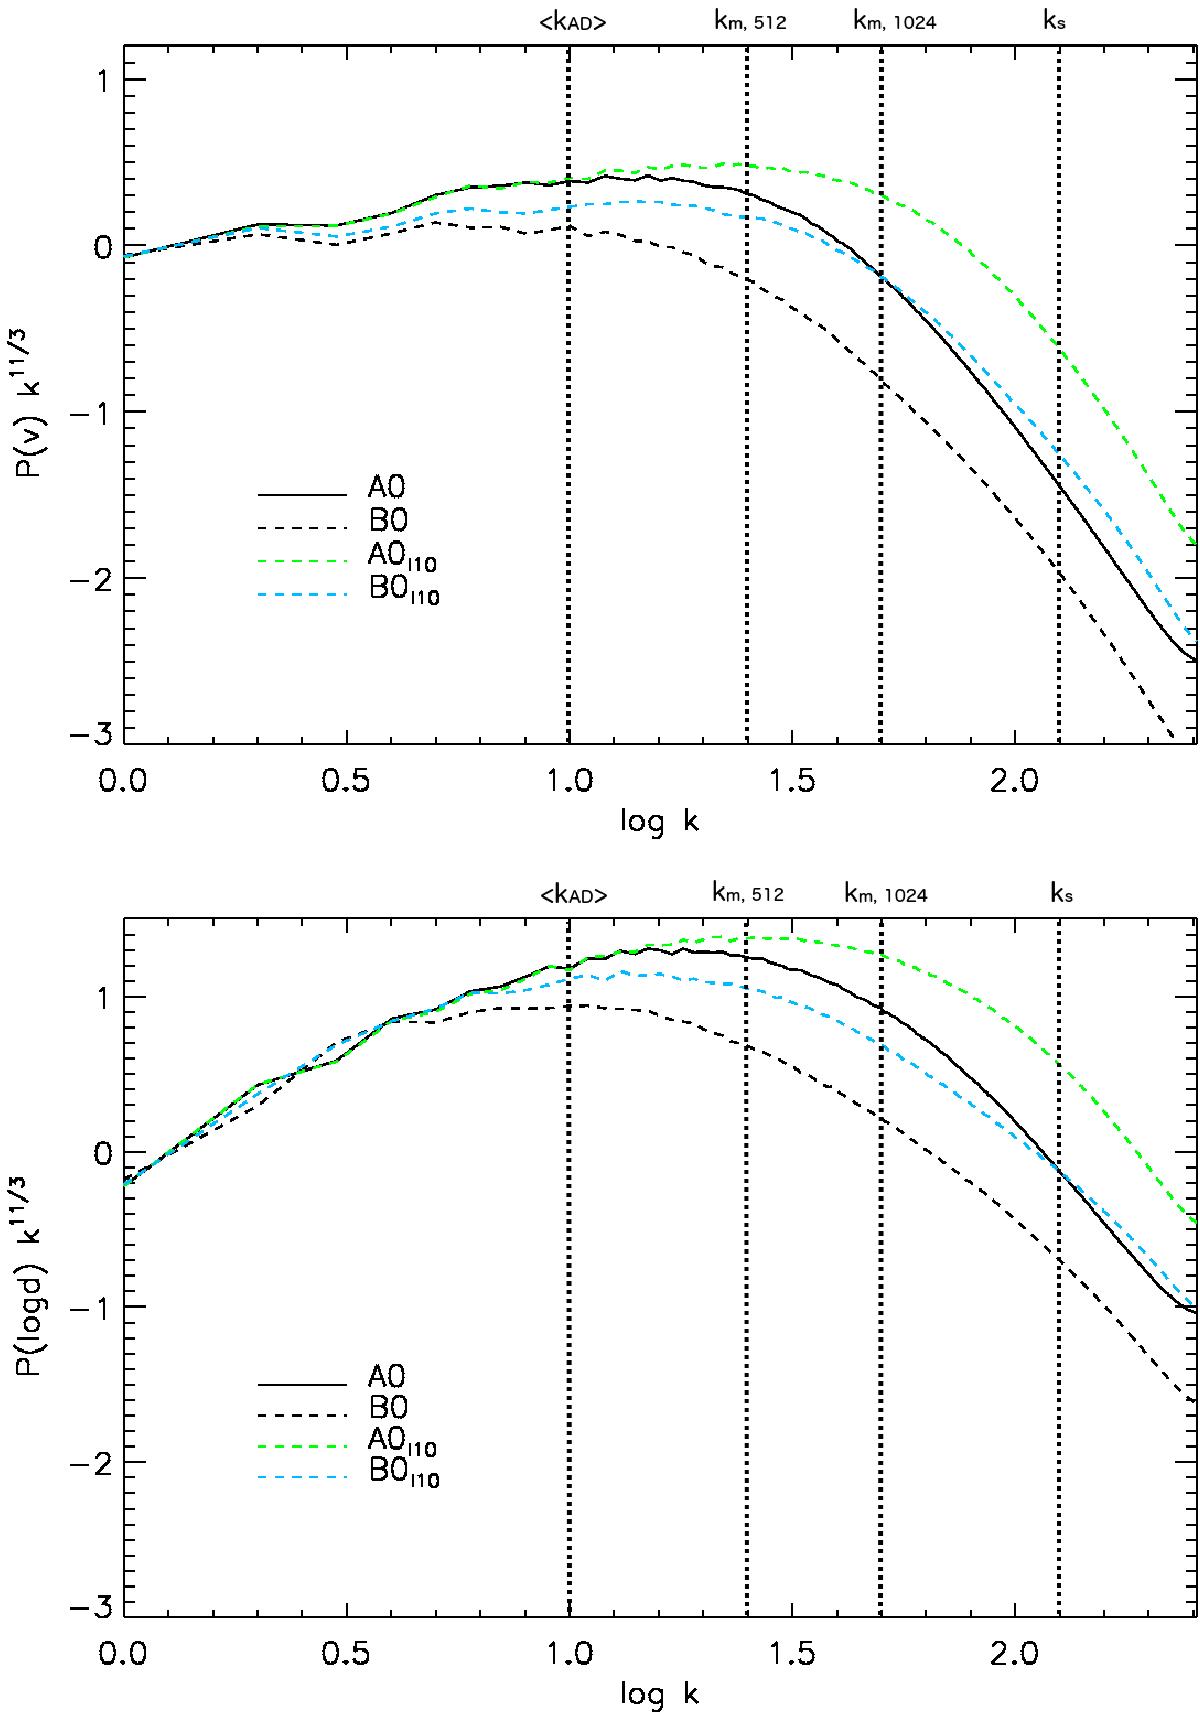
Comparison of the compensated power spectra in different resolutions. At the top, velocity power spectra, and at the bottom, power spectra of the logarithm of the density. As indicated on the label, the solid black line refers to run A0 and the dashed lines refer to runs B0, A0l10 and B0l10. The vertical dotted lines show the mean ambipolar diffusion scale, ⟨ kAD ⟩, the numerical dissipation scales, km,512 and km,1024 of the two resolutions and the sonic scale, ks. Runs A0l10 and B0l10 are run at double spatial resolution compared to A0 and B0.
Current usage metrics show cumulative count of Article Views (full-text article views including HTML views, PDF and ePub downloads, according to the available data) and Abstracts Views on Vision4Press platform.
Data correspond to usage on the plateform after 2015. The current usage metrics is available 48-96 hours after online publication and is updated daily on week days.
Initial download of the metrics may take a while.