Fig. 2
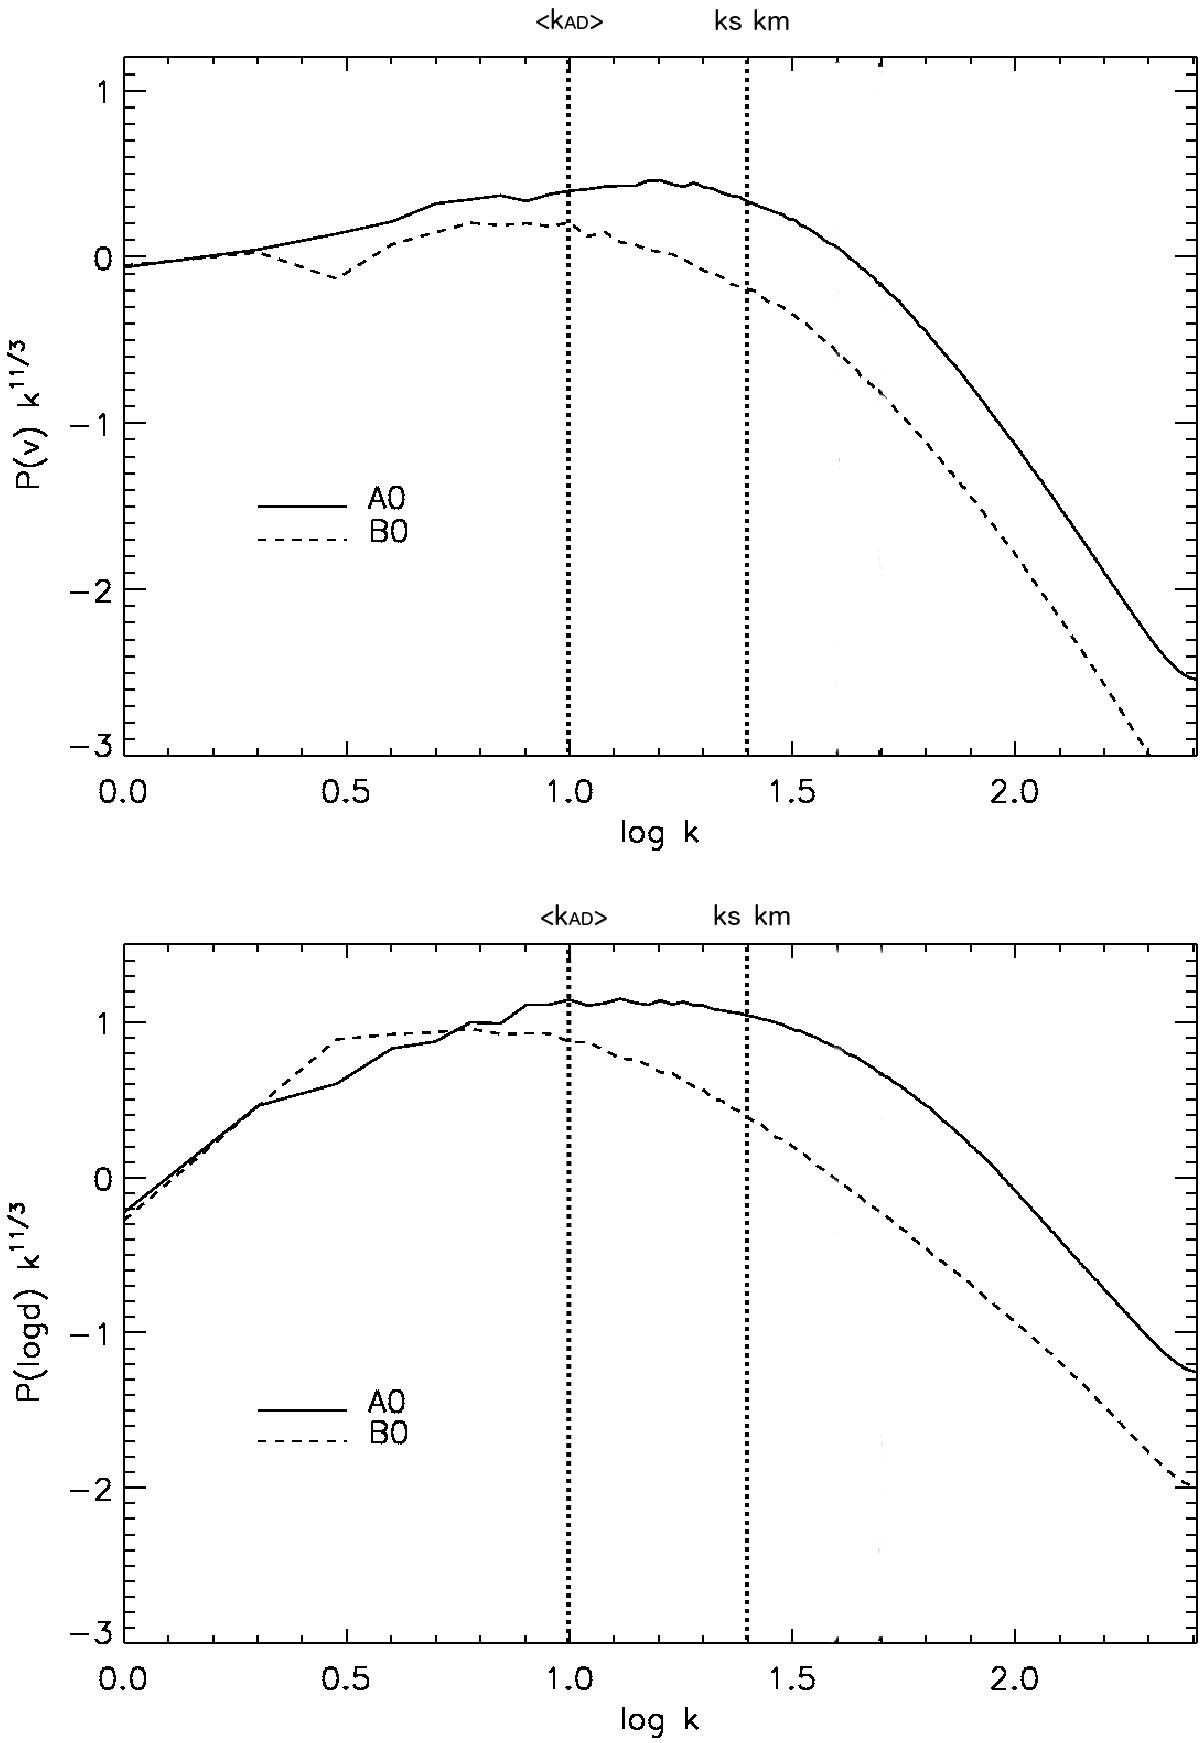
Compensated velocity (top) and log density (bottom) power spectra for runs A0 and B0. Solid lines correspond to run A0 and dashed lines to run B0. The vertical dotted lines show the ambipolar diffusion scale, kAD, calculated for the mean density in the simulation, n0 = 500 cm-3, the resolution scale, km, and the sonic scale, ks. The spectra are shown for a simulation time t = 10-2, which is 0.62 Myr in physical units. The turbulence crossing time is roughly 0.4 Myr.
Current usage metrics show cumulative count of Article Views (full-text article views including HTML views, PDF and ePub downloads, according to the available data) and Abstracts Views on Vision4Press platform.
Data correspond to usage on the plateform after 2015. The current usage metrics is available 48-96 hours after online publication and is updated daily on week days.
Initial download of the metrics may take a while.