Fig. A.1
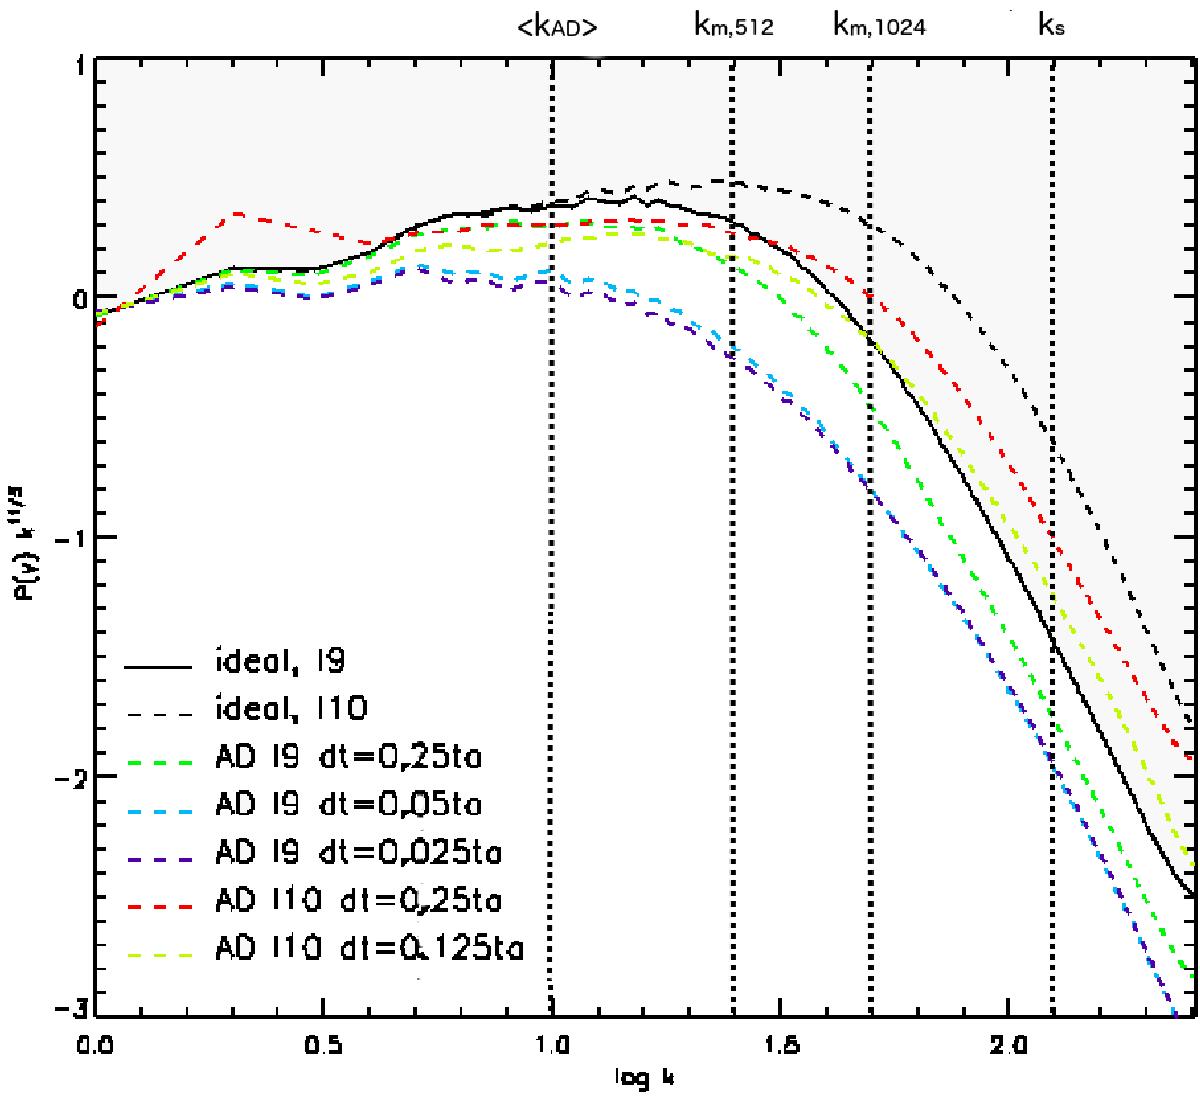
Compensated velocity power spectra for decaying turbulence simulations at time t = 5 × 10⁻³ using different timestep limits. The black solid line corresponds to the ideal 5123 run and the black dashed line to the ideal 10243 run. The vertical dotted lines show the mean ambipolar diffusion scale, ⟨ kAD ⟩, the numerical dissipation scales, km,512 and km,1024 of the two resolutions and the sonic scale, ks (ks and km,1024 are practically the same). Run B0, used as reference in the main body of the paper, uses a timestep limit dt = 0.05ta, where ta the Alfvén crossing time of a cell.
Current usage metrics show cumulative count of Article Views (full-text article views including HTML views, PDF and ePub downloads, according to the available data) and Abstracts Views on Vision4Press platform.
Data correspond to usage on the plateform after 2015. The current usage metrics is available 48-96 hours after online publication and is updated daily on week days.
Initial download of the metrics may take a while.