Fig. 10
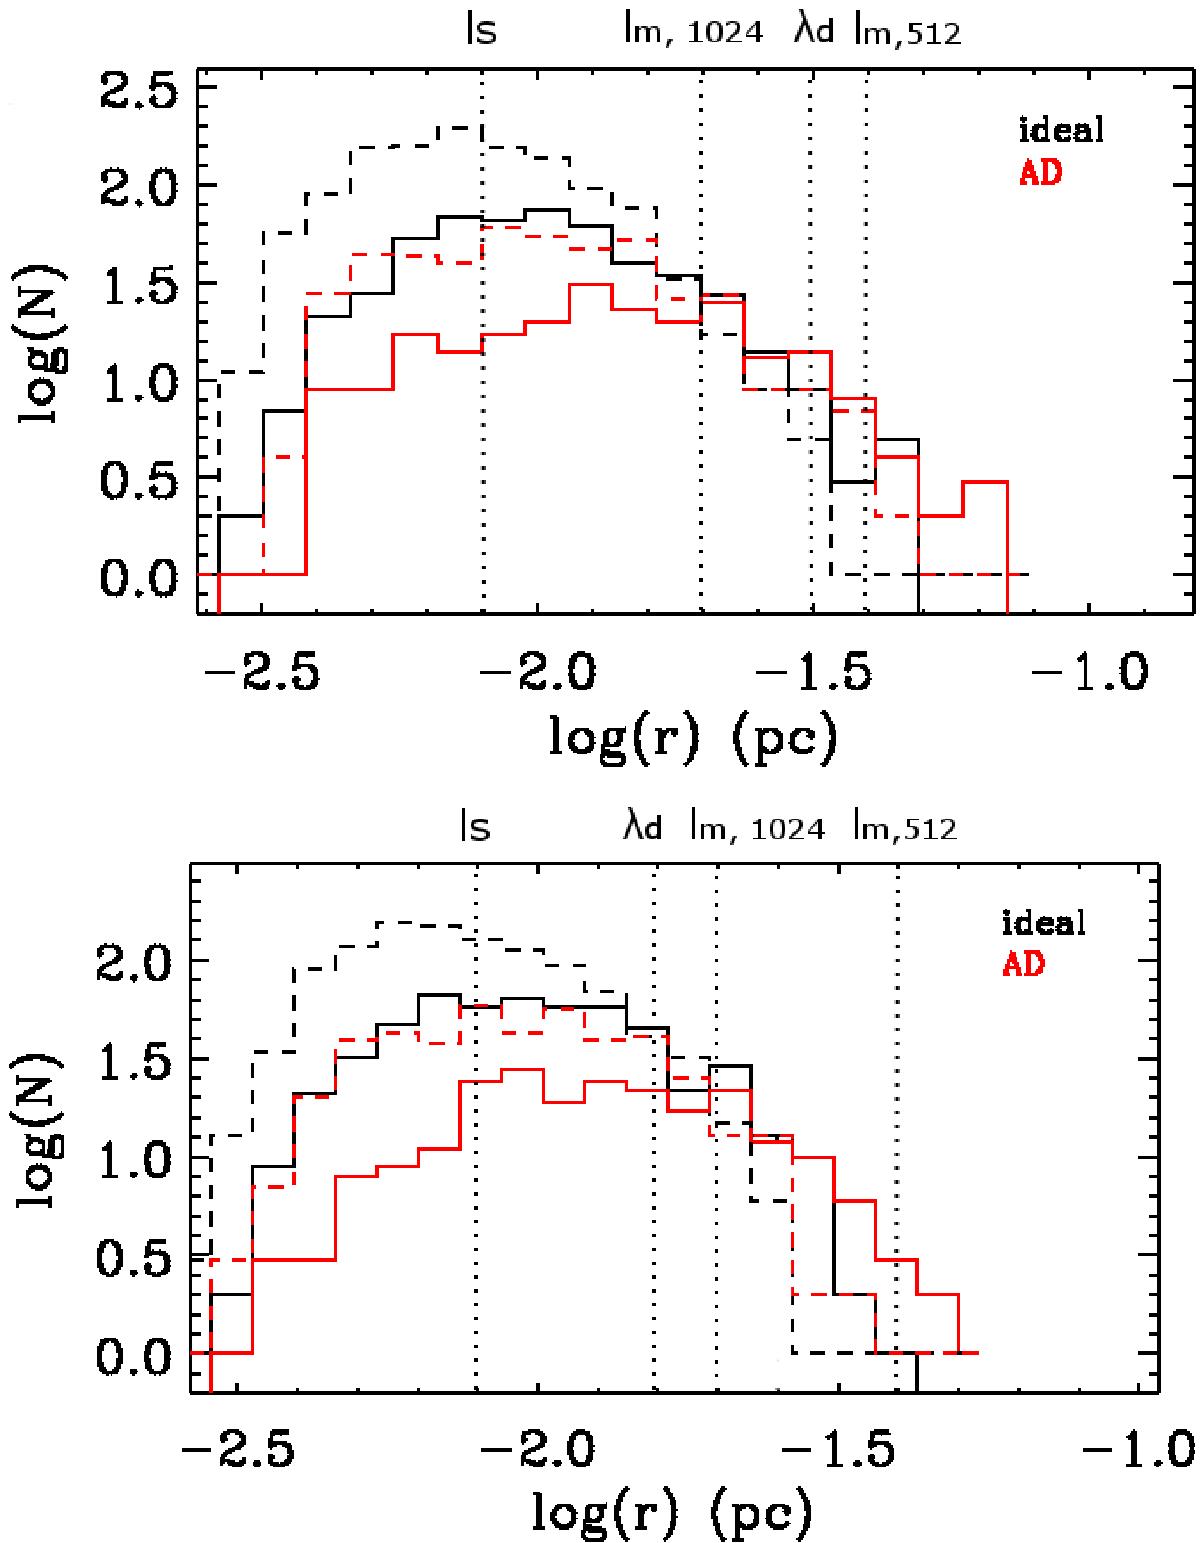
Thickness distributions of runs A0 and B0 at time t = 5 × 10⁻³. Black lines correspond to the ideal MHD runs and red lines to the runs with ambipolar diffusion. The corresponding dashed lines show the 10243 cases. Above, threshold 2000 cm-3 for filament identification, below, threshold of 5000 cm-3. The dotted lines indicate the mean ambipolar diffusion dissipation length λd, calculated from Eq. (1) for each density threshold, the resolution lengths lm,512 and lm,1024, equal to the length of 20 cells, and the sonic length ls, defined by Eq. (11), for an rms Mach number of 5.
Current usage metrics show cumulative count of Article Views (full-text article views including HTML views, PDF and ePub downloads, according to the available data) and Abstracts Views on Vision4Press platform.
Data correspond to usage on the plateform after 2015. The current usage metrics is available 48-96 hours after online publication and is updated daily on week days.
Initial download of the metrics may take a while.