Free Access
Fig. 15
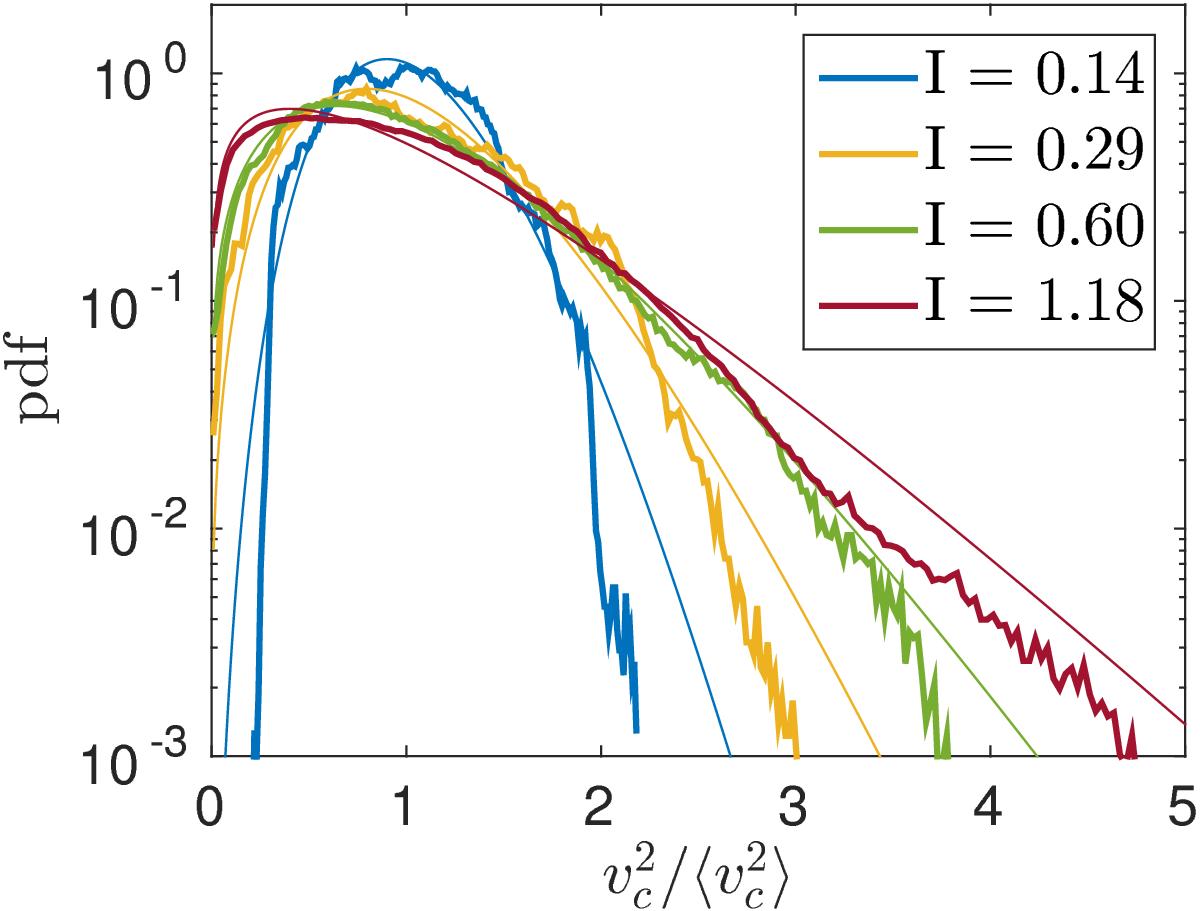
Probability density function of the impact velocity normal to the planetesimal surface for St = 0.8 and several turbulent intensities as labeled. The bold lines correspond to measurements from numerical simulations, while the thin lines refer to the non-central chi-squared prediction (see text).
Current usage metrics show cumulative count of Article Views (full-text article views including HTML views, PDF and ePub downloads, according to the available data) and Abstracts Views on Vision4Press platform.
Data correspond to usage on the plateform after 2015. The current usage metrics is available 48-96 hours after online publication and is updated daily on week days.
Initial download of the metrics may take a while.