| Issue |
A&A
Volume 589, May 2016
|
|
|---|---|---|
| Article Number | A74 | |
| Number of page(s) | 12 | |
| Section | Interstellar and circumstellar matter | |
| DOI | https://doi.org/10.1051/0004-6361/201527174 | |
| Published online | 14 April 2016 | |
28SiO v = 0 J = 1–0 emission from evolved stars
1
Observatorio de Yebes (IGN),
Apartado 148,
19180
Yebes,
Spain
e-mail:
This email address is being protected from spambots. You need JavaScript enabled to view it.
2
Observatorio Astronómico Nacional (OAN-IGN),
Apartado 112, 28803
Alcalá de Henares,
Spain
3
Observatorio Astronómico Nacional (OAN-IGN),
Alfonso XII 3, 28014
Madrid,
Spain
4
Instituto Geográfico Nacional, General Ibañez de Ibero 3, 28003
Madrid,
Spain
Received: 11 August 2015
Accepted: 24 February 2016
Abstract
Aims. Observations of 28SiO v = 0J = 1–0 line emission (7-mm wavelength) from asymptotic giant branch (AGB) stars show in some cases peculiar profiles, composed of a central intense component plus a wider plateau. Very similar profiles have been observed in CO lines from some AGB stars and most post-AGB nebulae and, in these cases, they are clearly associated with the presence of conspicuous axial symmetry and bipolar dynamics. We aim to systematically study the profile shape of 28SiO v = 0J = 1–0 lines in evolved stars and to discuss the origin of the composite profile structure.
Methods. We present observations of 28SiO v = 0J = 1–0 emission in 28 evolved stars, including O-rich, C-rich, and S-type Mira-type variables, OH/IR stars, semiregular long-period variables, red supergiants and one yellow hypergiant. Most objects were observed in several epochs, over a total period of time of one and a half years. The observations were performed with the 40 m radio telescope of the Instituto Geográfico Nacional (IGN) in Yebes, Spain.
Results. We find that the composite core plus plateau profiles are systematically present in O-rich Miras, OH/IR stars, and red supergiants. They are also found in one S-type Mira (χ Cyg) and in two semiregular variables (X Her and RS Cnc) that are known to show axial symmetry. In the other objects, the profiles are simpler and similar to those observed in other molecular lines. The composite structure appears in the objects in which SiO emission is thought to come from the very inner circumstellar layers, prior to dust formation. The central spectral feature is found to be systematically composed of a number of narrow spikes, except for X Her and RS Cnc, in which it shows a smooth shape that is very similar to that observed in CO emission. These spikes show a significant (and mostly chaotic) time variation, while in all cases the smooth components remain constant within the uncertainties. The profile shape could come from the superposition of standard wide profiles and a group of weak maser spikes confined to the central spectral regions because of tangential amplification. Alternatively, we speculate that the very similar profiles detected in objects that are known to be conspicuously axisymmetric, such as X Her and RS Cnc, and in O-rich Mira-type stars, such as IK Tau and TX Cam, may be indicative of the systematic presence of a significant axial symmetry in the very inner circumstellar shells around AGB stars; such symmetry would be independent of the presence of weak maser effects in the central spikes.
Key words: stars: AGB and post-AGB / circumstellar matter / radio lines: stars
© ESO, 2016
1. Introduction
SiO rotational line emission is often detected in evolved stars. These lines are particularly intense in O-rich asymptotic giant branch (AGB) circumstellar envelopes (CSEs), but they are also detected in C-rich objects and other evolved stars. The low-J vibrationally excited (v ≥ 1) lines present intense maser emission in AGB stars, particularly in O-rich Mira-type variables (Buhl et al. 1974; Bujarrabal et al. 1987; Alcolea et al. 1990; Jewell et al. 1991; Deguchi et al. 2010; Cho & Kim 2012, etc.). Their profiles present some narrow spikes, distributed over a spectral band of a few km s-1. The maser emitting region is very small, consisting of a number of spots in a ring-like structure with a radius of few stellar radii that are centered on the star (e.g. Diamond et al. 1994; Gonidakis et al. 2013; Desmurs et al. 2014), this structure is due to the dominant tangential amplification. The variability of these masers is very strong and, at least in regular pulsators, tightly follows the stellar IR variability cycle (similar to the optical variability cycle, but with a phase shift of about 0.1–0.2); see e.g. Pardo et al. (2004).
The v = 0J = 2–1 and higher-J lines have also been observed in AGB and post-AGB CSEs. It seems to be a typical thermal emission, which is much weaker than the v> 0 masers and shows wider profiles that are more or less comparable to those observed in lines of other standard molecules, such as CO, HCN, etc. (e.g. González Delgado et al. 2003; Bujarrabal et al. 1989; Schöier et al. 2011). In O-rich AGB stars, the v = 0J = 2–1 line probably originates in very inner shells, within about 1015 cm, as shown by interferometric maps (Lucas et al. 1992), see also González Delgado et al. (2003). In this region, grains are still being formed and the velocity gradient is still noticeable, which explains the presence of silicon in the gas, not yet fully locked into grains, as well as the observed triangular line profiles (e.g. Bujarrabal et al. 1989). On the contrary in C-rich AGB stars this line seems to come from more extended shells and the profiles are very similar to those of the standard molecules arising from the bulk of the envelope.
The v = 0 rotational lines of the rare isotopes, 29SiO and 30SiO, sometimes present spiky profiles that are attributed to maser emission. These lines are weaker than 28SiO v> 0 masers, but are stronger than the 28SiO v = 0 lines (Alcolea & Bujarrabal 1992).
The 28SiO v = 0J = 1–0 emission from evolved stars, at 7-mm wavelength, has been scarcely studied so far, since it is relatively weaker than the v> 0 masers. In some objects, it was found to show very peculiar composite profiles (Jewell et al. 1991) with a wide and smooth plateau and a central spiky component that was proposed to be due to weak maser emission (Boboltz & Claussen 2004). Remarkably, similar composite profiles have been observed in standard thermal lines, particularly in CO, coming from a rare class of objects, most of which are semiregular variables; see Knapp et al. (1998), Libert et al. (2010) and Castro-Carrizo et al. (2010). In contrast to the case of the majority of AGB shells, in these objects the whole circumstellar envelope is strongly axisymmetric; it is an hourglass-like structure that consists of a slowly expanding equatorial disk (at ≲5 km s-1) that is responsible for the central spectral feature, plus a somewhat faster bipolar outflow (expanding at ~10 km s-1). The axial structure and line profiles found in these semiregular stars is very similar to what is typical of young planetary and protoplanetary nebulae (PNe, PPNe; see CO emission data in e.g. Bujarrabal et al. 2001; Alcolea et al. 2007) although in post-AGB nebulae the involved velocities are significantly higher. The mechanism responsible for the spectacular evolution from AGB CSEs to form PPNe and PNe is still under debate. It is thought to involve the effects of a companion on the inner circumstellar regions (see Blackman & Lucchini 2014, and references therein). In this scenario, the companion should also affect (at least) the inner shells in the AGB phase, yielding some kind of axisymmetric structure. In some objects, binarity is known to yield a large-scale axial symmetry in AGB CSEs (e.g. Ramstedt et al. 2014), which seems to be the case for the above mentioned semiregular variables but certainly not for most AGB stars.
In this paper, we present a wide survey of 28SiO v = 0J = 1–0 emission from evolved stars of different kinds which also includes observations in different epochs of a number of sources; we show that such composite profiles systematically appear in O-rich and S-type sources. We will suggest that the 28SiO v = 0 line in O-rich AGB stars is formed, as the other SiO lines, in very inner circumstellar shells, and that the observed composite profiles may reflect the systematically axisymmetric structure of these regions, although at large scales such effects would in some way disappear or be more difficult to detect.
2. Observations
The observations were performed with the 40 m radio telescope, operated by the National Geographic Institute (IGN) in Yebes Observatory (Spain). The telescope is located at 40°31′ 28.̋78 north, 03°05′ 12.̋71 west and 980 m above sea level. Weather conditions are typically dry; the amount of precipitable water toward the zenith ranges between 4 mm in winter to 14 mm in summer. The antenna has an homological design and operates in Nasmyth focus. The primary mirror backstructure is covered with a cladding and has a forced air flow to keep the temperature homogeneous, but since it is not hermetically isolated from the outside and temperature controlled, it suffers some astigmatism when temperature along the day changes more than 10 degrees. This has a relevant effect at frequencies above 70 GHz. The Half Power Beam Width (HPBW) at 43 GHz is 44 arcsecs.
The antenna is equipped with a dual-polarization (LCP and RCP) single-pixel 45 GHz cryogenic receiver mounted in a Nasmyth focus. During the observations described in this paper the receiver was upgraded and its location moved to a new position in the Nasmyth cabin. Observations from the first epoch, those performed in 2013 and 2014, have a higher receiver noise temperature than those in the second epoch. Since the beginning of 2015 the receiver was improved and the system noise temperature dropped approximately by 30 K in both polarization channels, to about 90 K.
Calibration at 43 GHz is carried out using the chopper wheel method. A hot load at ambient temperature and the sky as cold load were used to calibrate the data. Opacity was estimated theoretically using the ATM code (Pardo et al. 2001, 2002) and weather conditions measured at a metereological station 400 m away from the antenna. The error in the determination of the sky opacity was estimated comparing the results from ATM with those obtained from skydip measurements, from which the forward efficiency of the antenna (90%) was also estimated. In all cases the error was always below 10%. We also tested the validity of the sky as cold load by comparing the receiver temperature determined using this same chopper wheel method with a hot and cold load method using liquid nitrogen. The difference is also 10% at most. All together, we estimate that the total calibration uncertainty of our observations is ±20%.
The conversion between antenna temperature ( ) and flux scales, 0.16 K/Jy, was obtained using observations toward sources with well-known flux and size, such as the planets Venus, Mars, Jupiter, and Saturn, which were scheduled in all observing runs. The conversion depends mainly on the aperture efficiency of the telescope, which we have estimated to be 30% ± 10% in an elevation range between 20 and 80 degrees. Systematic variations of the efficiency with elevation were parameterized and taken into account. Small variations (10%) in the efficiency can be seen between epochs with very different ambient temperatures, but this variability is included in the calibration error budget explained earlier.
The 45 GHz receiver has an instantaneous 8 GHz bandwidth. The signal is downconverted and the Intermediate Frequency (IF) split into 2 GHz bands, and later the IF split into 0.5 GHz wide bands. The bands are fed into a fast Fourier transform spectrometer with several modules, which can be configured to provide different band widths and spectral resolutions. The observations described in this article used two 500 MHz modules, one per circular polarization, with 16 384 channels per module and a spectral resolution of 30 kHz (approximately 0.21 km s-1 at this frequency).
In order to keep a good pointing and focus, pseudo-continuum observations were performed every one or two hours toward sources with SiO v = 1J = 1–0 maser emission. Pseudo-continuum observations consist in subtracting the summed spectral emission from the SiO maser from the rest of the spectrum while performing a pointing drift, or a focus scan. This is a useful technique since local atmospheric conditions have a small influence on the results and the baselines obtained are rather flat. Pointing errors were always kept within 5′′ in both axes.
Observations consisted of spatial on-off scans with an integration time of 60 s, using a spatial reference 400′′ away in azimuth to subtract the atmospheric emission correctly. Calibration scans were performed every 20 min. The resulting baselines are good, and only simple first order baselines were removed from the observed profiles.
The calibration of observations previous to April 2014 was only approximate at first because before that date, the antenna efficiency and flux-to-temperature conversion were not systematically measured (using planets and other well-known sources). The absolute calibration of those observations was checked by comparing the intensities of the wide spectral components and, in particular, of the plateau (see Sect. 3.1) with observations of the same sources performed later, since these wide features are assumed to be constant. As discussed in Sect. 3.2, those sources in which the plateau is identified well (IK Tau, GX Mon, χ Cyg, etc.) show significantly constant plateau emission, at least within the calibration uncertainties. The corrections applied to those preliminary data were always moderate, within the general calibration uncertainty mentioned above. The narrow intense spikes, very clearly detected in many sources (Sect. 3.1), show strong variations (as described in Sect. 3.2).
3. Results
We have observed a total of 28 stars in 28SiO v = 0J = 1–0 emission (with rest frequency 43.423853 GHz), see data in Figs. 1 to 8 and A.1 to A.20. Our sample includes O-rich, S-type, and C-rich Mira-type variables, OH/IR stars, which are highly-obscured O-rich Miras with strong OH maser emission, O-rich super, and hypergiants and semiregular variables. Source properties are summarized in Table 1 and the different kinds of observed spectra are discussed in Sect. 3.1. A summary of the observational parameters is shown in Table A.1. Most objects were observed several times, and some of them were more systematically monitored; see detailed discussion on the observed variability in Sect. 3.2.
3.1. General properties of SiO v = 0 J = 1–0 emission from evolved stars
The O-rich and S-type Mira-type stars systematically show composite spectra, with a wide plateau plus more intense narrow spikes. This is conspicuously the case of, for instance, TX Cam (Fig. A.2), GX Mon (Fig. A.7), IK Tau (Fig. 2), R Leo (Fig. A.5), and the S-type star χ Cyg (Fig. 3). The plateau occupies a spectral range similar to that of the lines of CO, HCN, SiO v = 0J = 2–1, etc., and shares the same centroid. The total profile width is expected to give the final expansion velocity, while the centroid would indicate the stellar systemic velocity, see discussion in Sect. 1. The spikes are very narrow and in most cases occupy a relatively small total range also centered on the systemic velocity. In some stars, notably in TX Cam (Fig. A.2), R Cas (Fig. A.3), and probably in χ Cyg (Fig. 3), spikes also appear at more extreme velocities. The narrow spikes tend to show significant variability, contrary to the case of the plateau, which is remarkably constant; see discussion in Sect. 3.2.
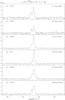 |
Fig. 1 SiO v = 0J = 1–0 spectra in the O-rich Mira-type variable star o Cet (Mira). The units and dates of the observations are indicated. The phase in the visible is shown in the upper left corner. |
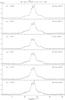 |
Fig. 2 SiO v = 0J = 1–0 spectra in the O-rich Mira-type variable star IK Tau. The units and dates of the observations are indicated. The phase in the visible is shown in the upper left corner. |
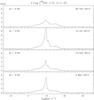 |
Fig. 3 SiO v = 0J = 1–0 spectra in S-type Mira-type variable star χ Cyg. The units and dates of the observations are indicated. The phase in the visible is shown in the upper left corner. |
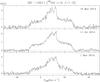 |
Fig. 4 SiO v = 0J = 1–0 spectra in the OH/IR star IRC +10011. The units and dates of the observations are indicated. |
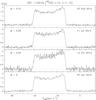 |
Fig. 5 SiO v = 0J = 1–0 spectra in C-rich Mira-type variable star IRC +10216 (CW Leo). The units and dates of the observations are indicated. The phase in the visible is shown in the upper left corner. |
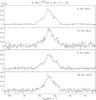 |
Fig. 6 SiO v = 0J = 1–0 spectra in the S-type semiregular variable star X Her. The units and dates of the observations are indicated. |
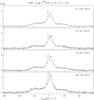 |
Fig. 7 SiO v = 0J = 1–0 spectra in the red supergiant star NML Cyg. The units and dates of the observations are indicated. |
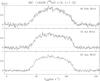 |
Fig. 8 SiO v = 0J = 1–0 spectra in the yellow hypergiant star IRC 10420. The units and dates of the observations are indicated. |
o Cet (Mira) is a peculiar case (Fig. 1). It shows a narrow SiO v = 0J = 1–0 profile, 2–3 km s-1 wide (and some variability in the whole spectrum). The profiles observed in CO from this source are about twice as wide (Planesas et al. 1990; Ramstedt et al. 2014) and show the same centroid. The CO profiles are known to come from a complex shell, which is probably affected by the presence of a stellar companion.
We have observed three OH/IR stars. These objects, which are thought to be very obscured O-rich Mira-type variables characterized by their intense OH maser emission, show profiles that are very similar to those of standard (optically brighter) O-rich Miras. That profile structure is particularly clear in IRC +10011 (Fig. 4) and OH 44.8-2.3 (Fig. A.10). OH 26.5+0.6 (Fig. A.9) seems to show similar profiles, but with a low S/N ratio that hampers our interpretation.
Observed sources: used coordinates, LSR velocity and spectral type.
The observed SiO v = 0J = 1–0 profiles of the O-rich red supergiants NML Cyg and VX Sgr (Figs. 7 and A.20 respectively) show properties that are very similar to those of most O-rich Mira-type variables, except for the width of the profiles, which is wider than ~50 km s-1. In the O-rich red supergiant VY CMa (Fig. A.18), we find a very intense and complex line profile, with many spikes occupying a very wide spectral region similar to the v> 0 masers. Finally, the red supergiant S Per (Fig. A.19) shows a complex and spiky profile, which is similar to that of VY CMa, but the line is less intense and narrower. In all monitored supergiant stars, the profiles are relatively constant with time (Sect. 3.2), even those with narrow spikes. The profiles observed in the yellow hypergiant IRC +10420 (Fig. 8) are wide and featureless, and very similar to those observed in other molecules (Quintana-Lacaci et al. 2007).
The C-rich Mira-type variables IRC +10216 (CW Leo, Fig. 5), LP And (Fig. A.11) and CIT 6 (RW LMi, Fig. A.12) show wide profiles with the standard shapes that are often found in AGB CSEs (and, in particular, in C-rich stars). However, the SiO v = 0J = 1–0 line is weak in these Mira-type variables compared with emission from other sources and with lines of C-bearing molecules observed in these sources.
We observed six O-rich semiregular variables, three of which, RX Boo, RS Cnc, and X Her, are known to present axisymmetric circumstellar shells; see Sect. 1. In all six cases, the SiO v = 0J = 1–0 profiles are comparable to those observed in CO. In X Her (Fig. 6), the SiO v = 0J = 1–0 profile is composite, which is similar to those we obtained in O-rich Miras, but with no sign of the spiky structure in the central spectral feature found in Miras. In this source, the composite CO profile is known to be due to the axial symmetry observed in interferometric maps (Castro-Carrizo et al. 2010), and the spectral central component comes from a very slow expanding disk or torus. RX Boo (Fig. A.13) shows axial symmetry in CO maps, but the single-dish CO profiles are simple and very similar to our featureless SiO v = 0J = 1–0 line. RS Cnc (Fig. A.14) shows CO spectra and shell structure similar to those of X Her; our data also show composite profiles similar to those of CO and to those found in X Her. In two other semiregular variables, R Crt and RT Vir (Figs. A.15 and A.17), the SiO v = 0J = 1–0 and CO profiles are also wide and mostly featureless; no evidence of axial symmetry has been found so far in these sources. Finally, W Hya is often catalogued as a semiregular variable, but its intensity curves are relatively regular both in the optical and SiO maser emission (Pardo et al. 2004). The SiO v = 0J = 1–0 profiles in W Hya (Fig. A.16) vaguely show a composite structure that is similar to that of O rich Miras which could be related to the fact that W Hya is considered almost a regular variable in some aspects.
3.2. Time variability of the v = 0 J = 1–0 SiO profiles
In order to check the time variability of the SiO v = 0J = 1–0 emission, line profiles were obtained several times in a number of stars, during a time period of longer than one year between about November 2013 and April 2015. We systematically monitored the stars TX Cam, R Cas, o Cet, IK Tau, χ Cyg, IRC +10216, VY CMa, NML Cyg, and X Her. As many as six independent observations were obtained in the best cases; other sources were observed two or three times.
As mentioned, the profiles in most O-rich and S-type Mira variables are composite with a wide plateau plus narrow spikes that often occupy the central parts of the profiles. The wide plateau is remarkably constant, within the uncertainties (Sect. 2). We can see this clearly in the cases of IK Tau, TX Cam, and the S-type star χ Cyg. The spikes, however, significantly vary, showing clear changes in their relative intensities. In any case, the overall variations of the SiO v = 0J = 1–0 is much more moderate than in the very strong v ≥ 1 masers; see for example, Pardo et al. (2004). Those strong maser lines can vary by orders of magnitude in both line peak and area, while these parameters rarely vary by a factor of two in our v = 0J = 1–0 observations (see, however, the exceptional cases of χ Cyg and R Cas in Figs. 3 and A.3, respectively).
In two cases, namely TX Cam (Fig. A.2) and R Cas (Fig. A.3), some spikes appear at more extreme velocities but not in all epochs. The variability of these satellite peaks is, in the few observed cases, significantly higher than for the rest of the observed features. In the case of χ Cyg (Fig. 3), there is a relative maximum at about 15 km s-1 LSR, which could be one of these moderate velocity spikes. However its low intensity and lack of significant variability (at our detection levels) prevent any conclusion in this respect. The variability of the particularly narrow profile found in o Cet (Fig. 1) is noticeable but moderate, and we can see changes in the profile shape.
In general, the variability of the spikes seems to be chaotic, without any obvious dependence on the optical or IR phase. Only the moderate velocity spike in R Cas could be associated with the phase, appearing more or less at the same time as the optical maximum of 2014. However, the moderate velocity peaks seen in TX Cam, between 20 and 25 km s-1, are not correlated with the optical phase. We conclude that there is no clear association between the optical or IR cycle and the variations found in the v = 0J = 1–0 spikes.
Some time variability is observed in the red supergiants, but this vairability is weaker than in the previously mentioned objects and much weaker than the very large variations found in their strong v> 0 maser emission (Pardo et al. 2004). In these objects the structure of the profiles is kept significantly constant with time. The SiO v = 0J = 1–0 emission from other sources observed several times (semiregular variables and C-rich Miras) do not show any clear variability. The profiles of the O-rich semiregular variable X Her, which are composite and similar to those of O-rich Miras (except for the spiky structure of the Miras), are remarkably constant within the uncertainties, see Fig. 6.
4. The origin of the two-component profiles of the 28SiO v = 0 J = 1–0 line
The relatively intense spikes that form the central spectral feature systematically observed in SiO v = 0J = 1–0 emission from O-rich and Miras and the S-type Mira χ Cyg are very narrow and time variable, suggesting that they are the result of maser emission (Boboltz & Claussen 2004). Their intensity is higher than that of the surrounding plateau; but it is much weaker, typically a hundred times weaker in flux units, than the intensity of the SiO v ≥ 1 masers observed in these sources. We recall that the vibrationally excited levels are expected to be strongly underpopulated. The energy of the v = 1 levels is about 1800 K higher in energy than the ground v = 0 levels (and the v = 2 levels are at about 3600 K from the ground). Moreover, the vibrational excitation temperature is expected to be of just some hundred Kelvin, even for high kinetic temperatures, since the very fast spontaneous decay of the vibrationally excited levels (faster than 5 s-1) prevents thermalization (in fact the v> 0 levels are mostly populated by the stellar IR radiation, see for example Bujarrabal et al. 1996) Therefore, the relative population of the vibrationally excited rotational levels must be smaller than 10%.
From their VLA maps, Boboltz & Claussen (2004) conclude that these spikes come from relatively wide spots, the strongest spike of each source is about 0.̋2–0.̋4 wide, in which the brightness is moderately high, 104–105 K. Meanwhile, the v> 0 maser spots are really tiny, at a few mas wide, and show a very high brightness ≳109 K (Diamond et al. 1994; Desmurs et al. 2014). In both cases, the maser spots are placed at a few stellar radii from the star, and the v = 0J = 1–0 emission is somewhat more extended; in angular units, the total extent is typically found to be ~0.̋2 for v = 0J = 1–0 emission and ≲0.̋1 for v> 0 masers.
The only way to explain the low brightness of the v = 0J = 1–0 spikes relative to the v> 0 masers, is to assume that the amplification of the maser effect responsible for the v = 0J = 1–0 (weak) masers is much lower than that of the strong masers. From the above mentioned brightness levels, we expect | τ(v = 0J = 1–0)|~| τ(v = 1J = 1–0)| – 10; in a rough estimate, | τ(v = 0J = 1–0)| must be of just a few units.
It is surprising that, in spite of the much higher population of the v = 0 rotational levels, the opacity modulus is so low, particularly compared with those of the v> 0 masers. We recall that τ∝x/Tex, where x is the relative population per magnetic sublevel (i.e., the average of the upper and lower levels, x = (nu/gu + nl/gl) / 2) and Tex is the excitation temperature of the maser transition. Therefore, Tex (∝ ) must be very high in absolute value, i.e. the population inversion must be extremely low with xu practically identical to xl and xu − xl ≪ x. The inversion of the v> 0 masers is already not very high in the intense spots, with Tex ~ −100 K (since the maser is probably saturated). In the v = 1J = 1–0 maser, for instance, the inversion is just of about 2%, x(J = 1)~x(J = 0) × 1.02. Hence we find a conservative upper limit of 0.1% on the v = 0J = 1–0 population inversion in the maser clumps that would be responsible for the observed narrow spikes in our profiles. Such a fine tuning of the level population leading to a very slight population inversion seems improbable and able to operate only in very peculiar conditions, but the v = 0J = 1–0 spikes are ubiquitous in O-rich Mira-type stars. The inversion of this transition would be due to an inefficient pumping mechanism, leading to very easily saturated maser emission with relatively low brightness levels. This is a situation that, to our knowledge, has only been found in this case. We think that the actual origin of the v = 0J = 1–0 spikes is not well understood yet.
4.1. Spectral features in O-rich Mira-type and semiregular variables
The profile structures found in O-rich Mira-type variables (including the S-type star χ Cyg) and in the semiregular variables X Her and RS Cnc are remarkable. In all cases, the line is composite, with a central stronger feature plus a wider plateau. The central feature is, however, different. While in Miras variables that component is composed of a number of narrow time-variable spikes, in the semiregulars it is smooth and does not show significant variability in our observations; this is probably because of thermal emission instead of population inversion. The plateau is in all cases constant with time and seems to be due to thermal emission.
The origin of the composite structure of the line profiles in X Her and RS Cnc (found not only in v = 0J = 1–0, but also in the other molecular lines, Sect. 1) is known to be due to the overall CSE structure, which is also complex. In contrast to what happens in most Miras, whose shells show a significant spherical symmetry at scales larger than 1′′ (Sect. 1), the CSEs around these semiregular variables show an equatorial slowly expanding disk and a bipolar low-collimation outflow, which are responsible for the central component and the plateau of the lines of SiO (and other molecules), respectively. This shell structure is similar, although with lower velocities, to that commonly observed in protoplanetary nebulae, which is the obvious precedent of the strong axial symmetry found in planetary nebulae (often showing torus-like or double-bubble structures).
As we have seen, we also find in Mira-type O-rich stars two-component profiles, in which the central spikes seem to show weak maser effects. The simplest explanation of these composite profiles is to assume that they come from the superposition of a standard wide profile, due to thermal emission from expanding shells, and a group of weak maser spikes, whose low projected velocity would be due to a predominantly tangential amplification (as found in the very intense v> 0 masers, Sect. 1). As an alternative, we speculate that the similar v = 0J = 1–0 profile shapes shown by these objects and by the above mentioned semiregular variables could indicate that, independent of the maser or thermal nature of the emission, the line shapes in both kinds of objects have a common origin: the presence of axial symmetry in the emitting region. In O-rich Miras, such an asymmetry would only appear in the very compact SiO emitting region, and at large scale would in some way disappear or be more difficult to detect, but would become dominant in later evolutionary phases. We finally note that clear composite structures are not usually found in higher-Jv = 0 SiO profiles (Sect. 1). The reason for this could be that the maser effect found in v = 0J = 1–0, which is certainly very peculiar, does not appear in other v = 0 transitions and/or that absorption by outer regions is very high in those lines; the opacity of high-J lines is expected to be high, since it increases roughly proportionally to J2 under these conditions of high excitation. The lack of maps with high sensitivity (allowing good images of the whole profiles) and angular resolution (allowing images at 0.̋1 scales) prevents any firm conclusion at the moment. We hope that future high-quality observations will throw light on this topic.
The two-component profiles also found in (at least some) red supergiants could also indicate that phenomena similar to those described above are present in their inner shells. The SiO v = 0 profiles of C-rich AGB stars (and some S-type objects) are, however, smooth and wide, which is very similar to those observed in the emission of other molecules. Maps of v = 0J = 2–1 emission (Sect. 1) show that its extent is significantly larger than for O-rich Miras, which is attributed to the different grain formation processes, but with a relatively low SiO abundance. The difference in the v = 0 profiles of C-rich and O-rich Mira-type stars would be due to these properties.
5. Summary and conclusions
We present observations of SiO v = 0J = 1–0 emission from 28 evolved stars, including O-rich, S-type and C-rich Mira-type variables, OH/IR (O-rich) stars, O-rich semiregular long-period variables, red supergiant stars, and one yellow hypergiant star. All these stars are more or less regular pulsators with long periods of about one year or more and are known to be surrounded by thick circumstellar envelopes (CSEs) emitting in maser and thermal (not masing) molecular lines; see Sect. 1. We performed studies of the emission variability in about one half of the sources, spanning over more than one year.
In most O-rich and S-type Mira-type stars (including the OH/IR objects), the observed profiles are composite, with a wide spectral feature or plateau and a set of narrow, relatively intense spikes in the line center (Sect. 3.1). The plateau occupies roughly the same velocity range as the smooth profiles characteristic of thermal molecular lines (CO, HCN, SiO v = 0J = 2–1, etc.). The spikes occupy a central narrower spectral region and are probably the result of weak maser effects (see below). A peculiar case is o Cet, (Mira, a binary O-rich star showing an asymmetric shell), which shows narrow spiky profiles of SiO v = 0J = 1–0.
The SiO v = 0J = 1–0 line in C-rich stars shows smooth featureless profiles, very similar to those of the other molecules and probably due to thermal emission.
The observed supergiants also show complex profiles with many spikes. NML Cyg, S Per, and VX Sgr show two-component profiles similar to those observed in O-rich Miras (except for the larger total width). The yellow hypergiant IRC +10420 shows a smooth profile, which is very similar to those of standard lines.
The SiO v = 0J = 1–0 profiles of the selected semiregular giants are smooth, except for the spiky profiles found in W Hya (a source that shows a very regular variability and is sometimes catalogued as Mira-type variable). Two semiregulars, X Her and RS Cnc, show composite profiles including a wide plateau plus a central stronger feature, but this profile is not composed of narrow spikes. Remarkably, the profiles of standard lines observed in X Her and RS Cnc, e.g., CO J = 1–0 and J = 2–1 (see Sects. 1, 3.1), are practically identical to those we find and are known to be associated with a significant axial symmetry of the circumstellar envelope.
Significant variability was found in the narrow spikes we detect in SiO v = 0J = 1–0 emission, mostly in the O-rich regular pulsators and the S-type Mira-type star χ Cyg (Sect. 3.2). However, the wide features, including the plateaus clearly identified in many sources, the two spectral components observed in X Her and RS Cnc, and the whole profiles of C-rich objects, are significantly constant within the calibration uncertainties. The variations of the narrow spikes are not clearly correlated with the stellar pulsation cycle.
The relatively intense spikes that form the central spectral feature systematically observed in O-rich and Miras and the S-type Mira χ Cyg are very narrow and time variable, suggesting that they are the result of maser emission (Sect. 3). Their intensity is higher than that of the surrounding plateau, but it is much lower, typically by a hundred times, than the intensity of the SiO v> 0 masers observed in these sources. The low flux and brightness characteristic of these spikes, despite the high relative population of the v = 0 rotational levels (Sect. 4), indicates that probably the maser pumping of the v = 0J = 1–0 spikes is very peculiar and much less efficient than that of the v> 0 masers.
The simplest explanation of the two-component v = 0J = 1–0 profiles observed in O-rich and S-type regular pulsators is that they are due to the superposition of standard wide profiles and a group of weak maser spikes coming from very inner layers, for which, as happens for the v> 0 strong masers, tangential amplification leads to a relatively narrow total dispersion in velocity; see Sect. 4.1. We speculate that it would be useful, if confirmed, to study the onset of axial structures in the post-AGB evolution, and that the similar profiles found in O-rich and S-type regular pulsators and in semiregular variables may have a similar origin (regardless of possible maser effects in the narrow spikes), indicating the systematic presence of axial symmetry in the innermost layers of most AGB CSEs. The CSEs of O-rich and S-type Miras are known to be spherical and isotropical at scales ≳1′′; their SiO thermal emission comes precisely from regions ~1′′ wide. Future high-quality maps at this frequency are expected to solve this question.
Acknowledgments
This work is based on observations carried out with the IGN 40 m radio telescope. We thank all the staff in Yebes Observatory for the generous help received. We acknowledge partial funding from MINECO grants AYA2012-32032, FIS2012-32096, and FIS2012-38160. This work has made use of the American Association of Variable Star Observers (AAVSO) database and of the SIMBAD Astronomical database (operated at CDS, Strasbourg, France).
References
- Alcolea, J., & Bujarrabal, V. 1992, A&A, 253, 475 [NASA ADS] [Google Scholar]
- Alcolea, J., Bujarrabal, V., & Gomez-Gonzalez, J. 1990, A&A, 231, 431 [NASA ADS] [Google Scholar]
- Alcolea, J., Neri, R., & Bujarrabal, V. 2007, A&A, 468, L41 [NASA ADS] [CrossRef] [EDP Sciences] [Google Scholar]
- Blackman, E. G., & Lucchini, S. 2014, MNRAS, 440, L16 [NASA ADS] [CrossRef] [Google Scholar]
- Boboltz, D. A., & Claussen, M. J. 2004, ApJ, 608, 480 [NASA ADS] [CrossRef] [Google Scholar]
- Buhl, D., Snyder, L. E., Lovas, F. J., & Johnson, D. R. 1974, ApJ, 192, L97 [NASA ADS] [CrossRef] [Google Scholar]
- Bujarrabal, V., Planesas, P., & del Romero, A. 1987, A&A, 175, 164 [NASA ADS] [Google Scholar]
- Bujarrabal, V., Gomez-Gonzalez, J., & Planesas, P. 1989, A&A, 219, 256 [NASA ADS] [Google Scholar]
- Bujarrabal, V., Alcolea, J., Sanchez Contreras, C., & Colomer, F. 1996, A&A, 314, 883 [NASA ADS] [Google Scholar]
- Bujarrabal, V., Castro-Carrizo, A., Alcolea, J., & Sánchez Contreras, C. 2001, A&A, 377, 868 [NASA ADS] [CrossRef] [EDP Sciences] [Google Scholar]
- Castro-Carrizo, A., Quintana-Lacaci, G., Neri, R., et al. 2010, A&A, 523, A59 [NASA ADS] [CrossRef] [EDP Sciences] [Google Scholar]
- Cho, S.-H., & Kim, J. 2012, AJ, 144, 129 [NASA ADS] [CrossRef] [Google Scholar]
- Deguchi, S., Shimoikura, T., & Koike, K. 2010, PASJ, 62, 525 [NASA ADS] [Google Scholar]
- Desmurs, J.-F., Bujarrabal, V., Lindqvist, M., et al. 2014, A&A, 565, A127 [NASA ADS] [CrossRef] [EDP Sciences] [Google Scholar]
- Diamond, P. J., Kemball, A. J., Junor, W., et al. 1994, ApJ, 430, L61 [NASA ADS] [CrossRef] [Google Scholar]
- Gonidakis, I., Diamond, P. J., & Kemball, A. J. 2013, MNRAS, 433, 3133 [NASA ADS] [CrossRef] [Google Scholar]
- González Delgado, D., Olofsson, H., Kerschbaum, F., et al. 2003, A&A, 411, 123 [NASA ADS] [CrossRef] [EDP Sciences] [Google Scholar]
- Jewell, P. R., Snyder, L. E., Walmsley, C. M., Wilson, T. L., & Gensheimer, P. D. 1991, A&A, 242, 211 [NASA ADS] [Google Scholar]
- Knapp, G. R., Young, K., Lee, E., & Jorissen, A. 1998, ApJS, 117, 209 [NASA ADS] [CrossRef] [Google Scholar]
- Libert, Y., Winters, J. M., Le Bertre, T., Gérard, E., & Matthews, L. D. 2010, A&A, 515, A112 [NASA ADS] [CrossRef] [EDP Sciences] [Google Scholar]
- Lucas, R., Bujarrabal, V., Guilloteau, S., et al. 1992, A&A, 262, 491 [NASA ADS] [Google Scholar]
- Pardo, J. R., Cernicharo, J., & Serabyn, E. 2001, IEEE Trans Antennas and Propagation 49, 1683 [Google Scholar]
- Pardo, J., Cernicharo, J., & Serabyn, E. 2002, in Astronomical Site Evaluation in the Visible and Radio Range, ASP Conf. Proc., 266, 188 [NASA ADS] [Google Scholar]
- Pardo, J. R., Alcolea, J., Bujarrabal, V., et al. 2004, A&A, 424, 145 [NASA ADS] [CrossRef] [EDP Sciences] [Google Scholar]
- Planesas, P., Bachiller, R., Martin-Pintado, J., & Bujarrabal, V. 1990, ApJ, 351, 263 [NASA ADS] [CrossRef] [Google Scholar]
- Quintana-Lacaci, G., Bujarrabal, V., Castro-Carrizo, A., & Alcolea, J. 2007, A&A, 471, 551 [NASA ADS] [CrossRef] [EDP Sciences] [Google Scholar]
- Ramstedt, S., Mohamed, S., Vlemmings, W. H. T., et al. 2014, A&A, 570, L14 [NASA ADS] [CrossRef] [EDP Sciences] [Google Scholar]
- Schöier, F. L., Maercker, M., Justtanont, K., et al. 2011, A&A, 530, A83 [NASA ADS] [CrossRef] [EDP Sciences] [Google Scholar]
Appendix A: Further observational data of v = 0 J = 1–0
This Appendix contains the spectra of stars not shown previously and the table summarizing the observational results.
Summary of observational results.
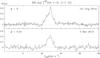 |
Fig. A.1 SiO v = 0J = 1–0 spectra in the O-rich Mira-type variable star RR Aql. The units and dates of the observations are indicated. The phase in the visible is shown in the upper left corner. |
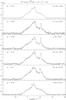 |
Fig. A.2 SiO v = 0J = 1–0 spectra in the O-rich Mira-type variable star TX Cam. The units and dates of the observations are indicated. The phase in the visible is shown in the upper left corner. |
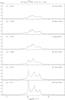 |
Fig. A.3 SiO v = 0J = 1–0 spectra in the O-rich Mira-type variable star R Cas. The units and dates of the observations are indicated. The phase in the visible is in the upper left corner. |
 |
Fig. A.4 SiO v = 0J = 1–0 spectra in the O-rich Mira-type variable star R Hya. The units and dates of the observations are indicated. |
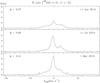 |
Fig. A.5 SiO v = 0J = 1–0 spectra in the O-rich Mira-type variable star R Leo. The units and dates of the observations are indicated. The phase in the visible is shown in the upper left corner. |
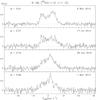 |
Fig. A.6 SiO v = 0J = 1–0 spectra in the O-rich Mira-type variable star R LMi. The units and dates of the observations are indicated. The phase in the visible is in the upper left corner. |
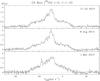 |
Fig. A.7 SiO v = 0J = 1–0 spectra in the O-rich Mira-type variable star GX Mon. The units and dates of the observations are indicated. |
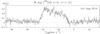 |
Fig. A.8 SiO v = 0J = 1–0 spectra in the S-type M-type variable star W Aql. The units and dates of the observations are indicated. |
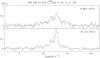 |
Fig. A.9 SiO v = 0J = 1–0 spectra in the OH/IR star OH 26.5+0.6. The units and dates of the observations are indicated. |
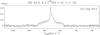 |
Fig. A.10 SiO v = 0J = 1–0 spectra in the OH/IR star OH 44.8-2.3. The units and dates of the observations are indicated. |
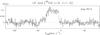 |
Fig. A.11 SiO v = 0J = 1–0 spectra in the C-rich Mira-type variable star LP And. The units and dates of the observations are indicated. We note the ripples in the baseline due to instrumental effects not corrected by our two-degree baseline removal. |
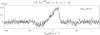 |
Fig. A.12 SiO v = 0J = 1–0 spectra in the C-rich Mira-type variable star CIT 6 (RW LMi). The units and dates of the observations are indicated. We note the ripples in the baseline due to instrumental effects not corrected by our one-degree baseline removal. |
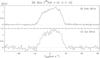 |
Fig. A.13 SiO v = 0J = 1–0 spectra in the O-rich semiregular variable RX Boo. The units and dates of the observations are indicated. |
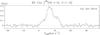 |
Fig. A.14 SiO v = 0J = 1–0 spectra in the S-type semiregular variable star RS Cnc. The units and dates of the observations are indicated. |
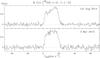 |
Fig. A.15 SiO v = 0J = 1–0 spectra in the O-rich semiregular variable star R Crt. The units and dates of the observations are indicated. |
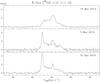 |
Fig. A.16 SiO v = 0J = 1–0 spectra in the O-rich semiregular variable W Hya. The units and dates of the observations are indicated. |
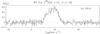 |
Fig. A.17 SiO v = 0J = 1–0 spectra in the O-rich semiregular variable star RT Vir. The units and dates of the observations are indicated. |
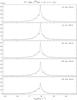 |
Fig. A.18 SiO v = 0J = 1–0 spectra in the red supergiant star VY CMa. The units and dates of the observations are indicated. |
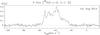 |
Fig. A.19 SiO v = 0J = 1–0 spectra in supergiant star S Per. The units and dates of the observations are indicated. |
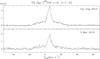 |
Fig. A.20 SiO v = 0J = 1–0 spectra in supergiant star VX Sgr. The units and dates of the observations are indicated. |
All Tables
All Figures
|
Fig. 1 SiO v = 0J = 1–0 spectra in the O-rich Mira-type variable star o Cet (Mira). The units and dates of the observations are indicated. The phase in the visible is shown in the upper left corner. |
| In the text | |
|
Fig. 2 SiO v = 0J = 1–0 spectra in the O-rich Mira-type variable star IK Tau. The units and dates of the observations are indicated. The phase in the visible is shown in the upper left corner. |
| In the text | |
|
Fig. 3 SiO v = 0J = 1–0 spectra in S-type Mira-type variable star χ Cyg. The units and dates of the observations are indicated. The phase in the visible is shown in the upper left corner. |
| In the text | |
|
Fig. 4 SiO v = 0J = 1–0 spectra in the OH/IR star IRC +10011. The units and dates of the observations are indicated. |
| In the text | |
|
Fig. 5 SiO v = 0J = 1–0 spectra in C-rich Mira-type variable star IRC +10216 (CW Leo). The units and dates of the observations are indicated. The phase in the visible is shown in the upper left corner. |
| In the text | |
|
Fig. 6 SiO v = 0J = 1–0 spectra in the S-type semiregular variable star X Her. The units and dates of the observations are indicated. |
| In the text | |
|
Fig. 7 SiO v = 0J = 1–0 spectra in the red supergiant star NML Cyg. The units and dates of the observations are indicated. |
| In the text | |
|
Fig. 8 SiO v = 0J = 1–0 spectra in the yellow hypergiant star IRC 10420. The units and dates of the observations are indicated. |
| In the text | |
|
Fig. A.1 SiO v = 0J = 1–0 spectra in the O-rich Mira-type variable star RR Aql. The units and dates of the observations are indicated. The phase in the visible is shown in the upper left corner. |
| In the text | |
|
Fig. A.2 SiO v = 0J = 1–0 spectra in the O-rich Mira-type variable star TX Cam. The units and dates of the observations are indicated. The phase in the visible is shown in the upper left corner. |
| In the text | |
|
Fig. A.3 SiO v = 0J = 1–0 spectra in the O-rich Mira-type variable star R Cas. The units and dates of the observations are indicated. The phase in the visible is in the upper left corner. |
| In the text | |
|
Fig. A.4 SiO v = 0J = 1–0 spectra in the O-rich Mira-type variable star R Hya. The units and dates of the observations are indicated. |
| In the text | |
|
Fig. A.5 SiO v = 0J = 1–0 spectra in the O-rich Mira-type variable star R Leo. The units and dates of the observations are indicated. The phase in the visible is shown in the upper left corner. |
| In the text | |
|
Fig. A.6 SiO v = 0J = 1–0 spectra in the O-rich Mira-type variable star R LMi. The units and dates of the observations are indicated. The phase in the visible is in the upper left corner. |
| In the text | |
|
Fig. A.7 SiO v = 0J = 1–0 spectra in the O-rich Mira-type variable star GX Mon. The units and dates of the observations are indicated. |
| In the text | |
|
Fig. A.8 SiO v = 0J = 1–0 spectra in the S-type M-type variable star W Aql. The units and dates of the observations are indicated. |
| In the text | |
|
Fig. A.9 SiO v = 0J = 1–0 spectra in the OH/IR star OH 26.5+0.6. The units and dates of the observations are indicated. |
| In the text | |
|
Fig. A.10 SiO v = 0J = 1–0 spectra in the OH/IR star OH 44.8-2.3. The units and dates of the observations are indicated. |
| In the text | |
|
Fig. A.11 SiO v = 0J = 1–0 spectra in the C-rich Mira-type variable star LP And. The units and dates of the observations are indicated. We note the ripples in the baseline due to instrumental effects not corrected by our two-degree baseline removal. |
| In the text | |
|
Fig. A.12 SiO v = 0J = 1–0 spectra in the C-rich Mira-type variable star CIT 6 (RW LMi). The units and dates of the observations are indicated. We note the ripples in the baseline due to instrumental effects not corrected by our one-degree baseline removal. |
| In the text | |
|
Fig. A.13 SiO v = 0J = 1–0 spectra in the O-rich semiregular variable RX Boo. The units and dates of the observations are indicated. |
| In the text | |
|
Fig. A.14 SiO v = 0J = 1–0 spectra in the S-type semiregular variable star RS Cnc. The units and dates of the observations are indicated. |
| In the text | |
|
Fig. A.15 SiO v = 0J = 1–0 spectra in the O-rich semiregular variable star R Crt. The units and dates of the observations are indicated. |
| In the text | |
|
Fig. A.16 SiO v = 0J = 1–0 spectra in the O-rich semiregular variable W Hya. The units and dates of the observations are indicated. |
| In the text | |
|
Fig. A.17 SiO v = 0J = 1–0 spectra in the O-rich semiregular variable star RT Vir. The units and dates of the observations are indicated. |
| In the text | |
|
Fig. A.18 SiO v = 0J = 1–0 spectra in the red supergiant star VY CMa. The units and dates of the observations are indicated. |
| In the text | |
|
Fig. A.19 SiO v = 0J = 1–0 spectra in supergiant star S Per. The units and dates of the observations are indicated. |
| In the text | |
|
Fig. A.20 SiO v = 0J = 1–0 spectra in supergiant star VX Sgr. The units and dates of the observations are indicated. |
| In the text | |
Current usage metrics show cumulative count of Article Views (full-text article views including HTML views, PDF and ePub downloads, according to the available data) and Abstracts Views on Vision4Press platform.
Data correspond to usage on the plateform after 2015. The current usage metrics is available 48-96 hours after online publication and is updated daily on week days.
Initial download of the metrics may take a while.