Free Access
Fig. 10
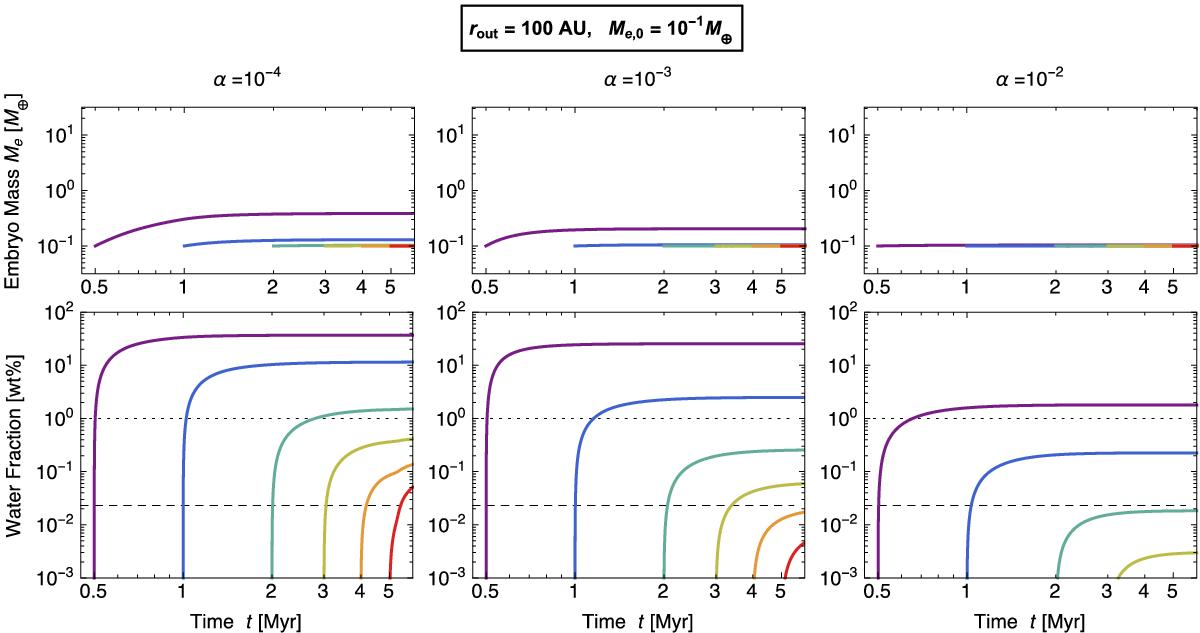
Time evolution of the mass Me and water fraction fH2O of an embryo placed at 1 AU with initial mass Me,0 = 10-1 M⊕ for the case of rout = 100 AU. The different curves show results for different initial times of pebble accretion, tstart = 0.5, 1, 2, 3, 4, and 5 Myr (from left to right).
Current usage metrics show cumulative count of Article Views (full-text article views including HTML views, PDF and ePub downloads, according to the available data) and Abstracts Views on Vision4Press platform.
Data correspond to usage on the plateform after 2015. The current usage metrics is available 48-96 hours after online publication and is updated daily on week days.
Initial download of the metrics may take a while.