Fig. 4
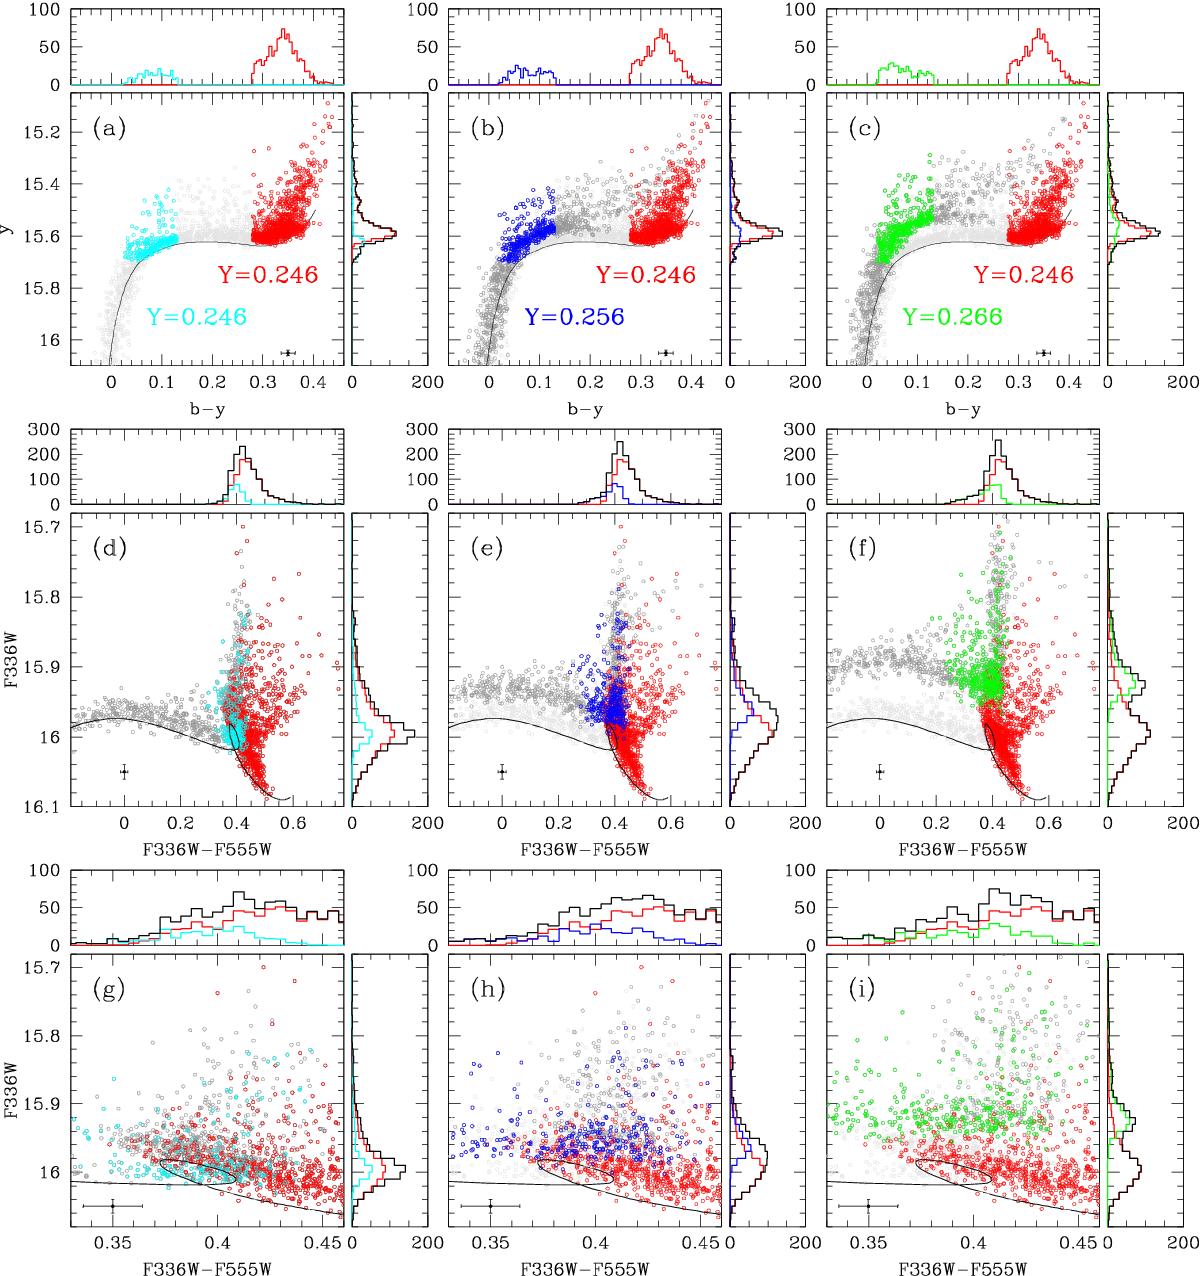
Synthetic CMDs at the HB level from models with Z = 0.001 in the filters of interest of the Strömgren (top panels) and WFPC2 (middle and bottom panels) systems. The ZAHB locus for Y = 0.246 is represented as a black line. A uniform mass deviate ranging from 0.595 to 0.705 M⊙ with 2100 stars is used to represent a helium-normal population (Y = 0.246, light gray circles). Helium-rich populations (Y = 0.256,0.266) are created with 1000 stars with masses ranging from 0.595 to 0.645 M⊙ (dark gray circles). Stars identified as RHB stars with Y = 0.246 are plotted as red circles. BHB stars are plotted in cyan for Y = 0.246, blue for Y = 0.256, and green for Y = 0.266. In these simulations, photometric errors are included, following the photometric data, at the level of 0.01 mag in each bandpass. Panels g)–i) are zoom-ins of panels d)–f), respectively. Each panel is accompanied by histograms showing the distribution in color (top) and magnitude (right) of the different components.
Current usage metrics show cumulative count of Article Views (full-text article views including HTML views, PDF and ePub downloads, according to the available data) and Abstracts Views on Vision4Press platform.
Data correspond to usage on the plateform after 2015. The current usage metrics is available 48-96 hours after online publication and is updated daily on week days.
Initial download of the metrics may take a while.