Fig. 5
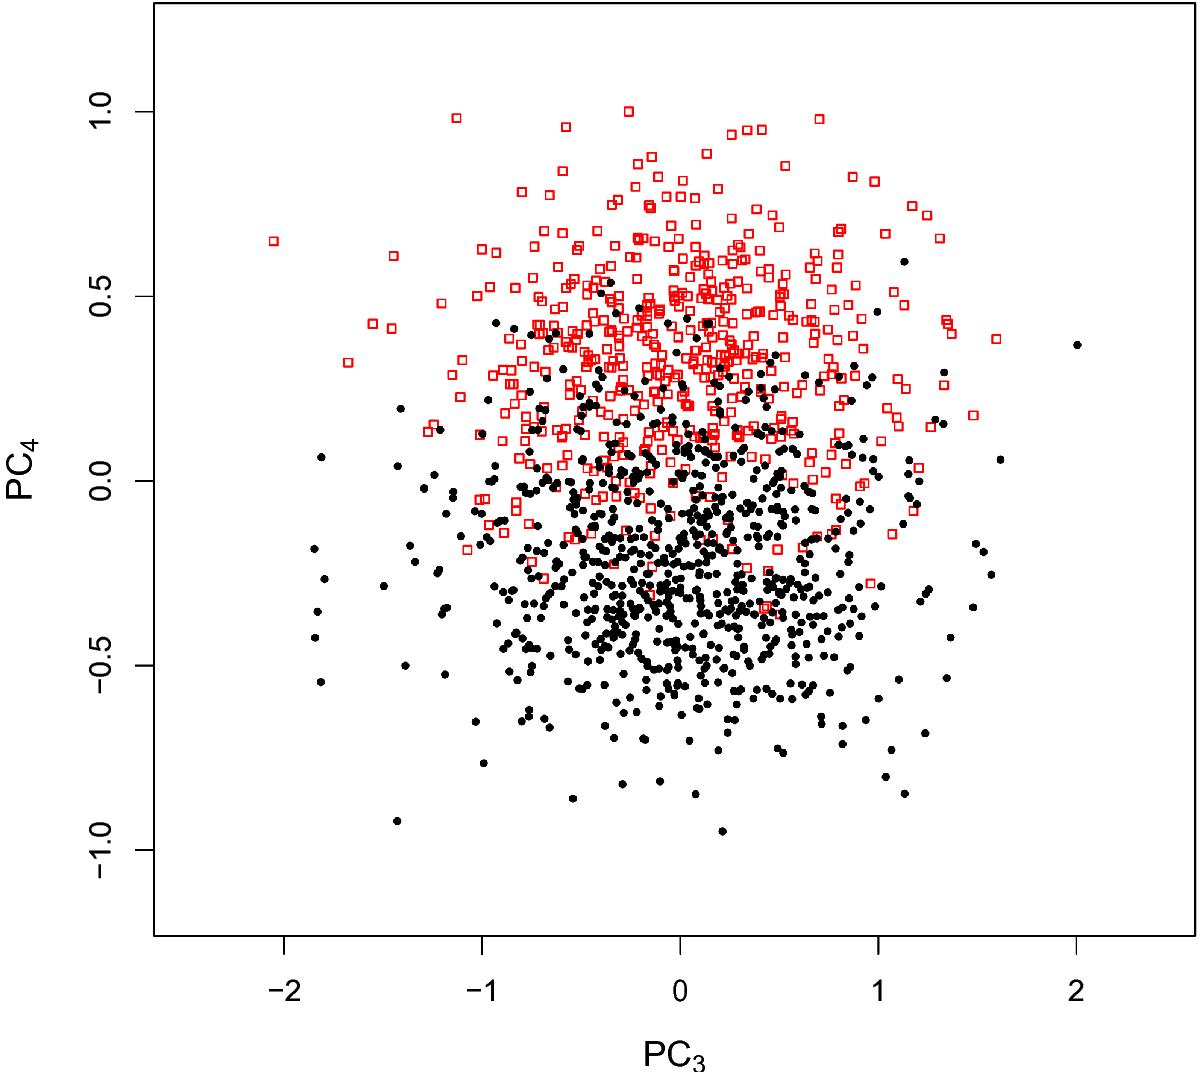
Feature space projected on the third and fourth principal components (PC3 on the x- and PC4 on the y-axis). As in Fig. 4, each symbol represents a mock observation, obtained from a snapshot. Different simulation runs are harder to distinguish in this projection, so the labels used in Fig. 4 have been dropped. Empty red symbols correspond to merger simulations, filled black symbols to monolithic simulations. Mergers and monolithic observations appear systematically different in PC4.
Current usage metrics show cumulative count of Article Views (full-text article views including HTML views, PDF and ePub downloads, according to the available data) and Abstracts Views on Vision4Press platform.
Data correspond to usage on the plateform after 2015. The current usage metrics is available 48-96 hours after online publication and is updated daily on week days.
Initial download of the metrics may take a while.