Fig. 4
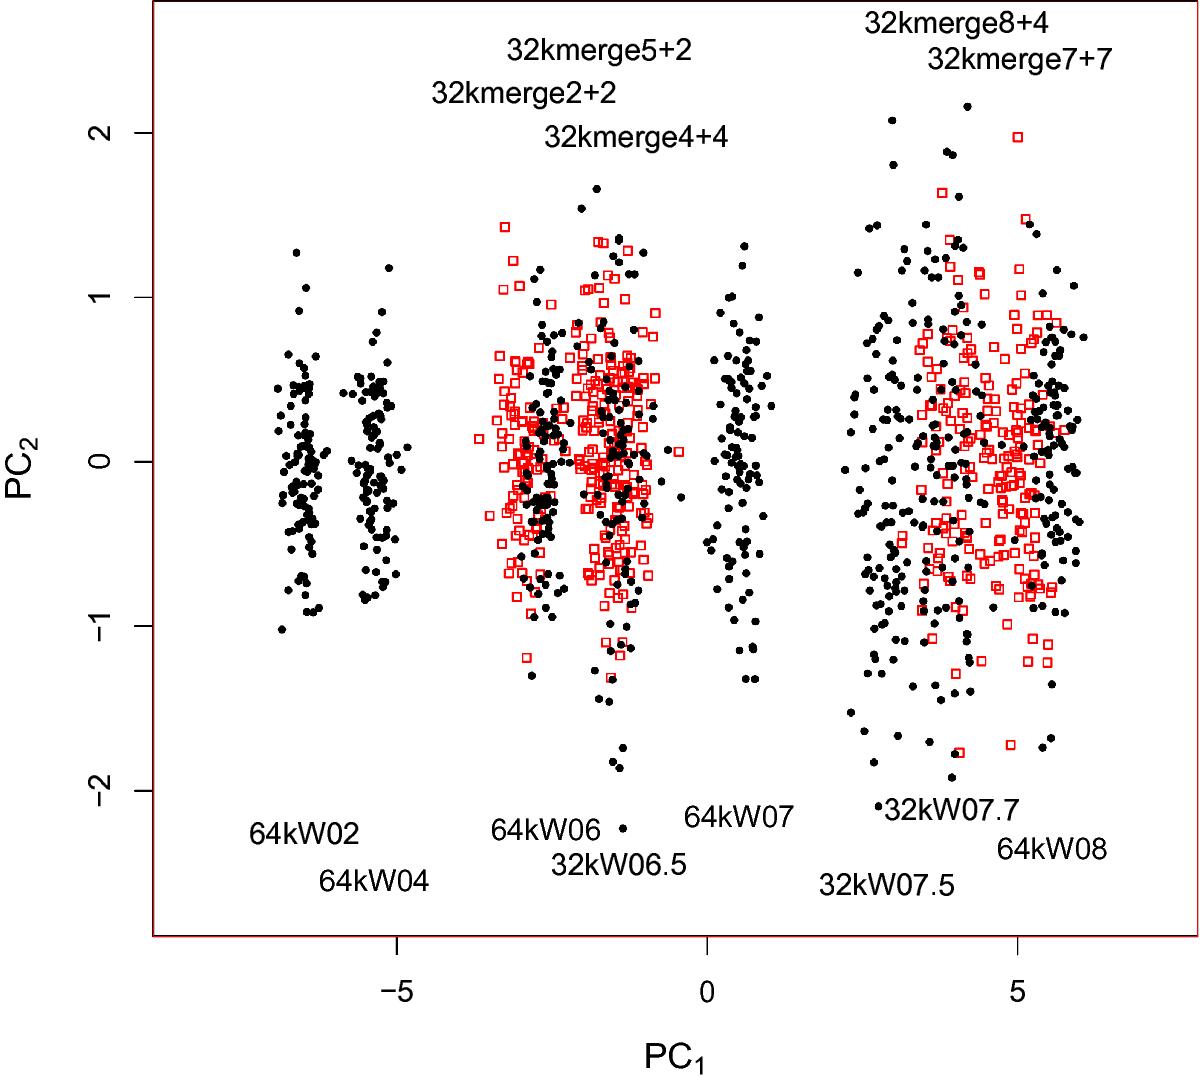
Feature space projected on the first two principal components (PC1 on the x- and PC2 on the y-axis). Each symbol represents a mock observation, obtained from a snapshot. Groups of symbols correspond to simulation runs and are labelled according to the name of each run. Empty red symbols correspond to merger simulations, filled black symbols to monolithic simulations. It appears that PC1 correlates with the initial dimensionless potential W0 of each run.
Current usage metrics show cumulative count of Article Views (full-text article views including HTML views, PDF and ePub downloads, according to the available data) and Abstracts Views on Vision4Press platform.
Data correspond to usage on the plateform after 2015. The current usage metrics is available 48-96 hours after online publication and is updated daily on week days.
Initial download of the metrics may take a while.