Fig. 2
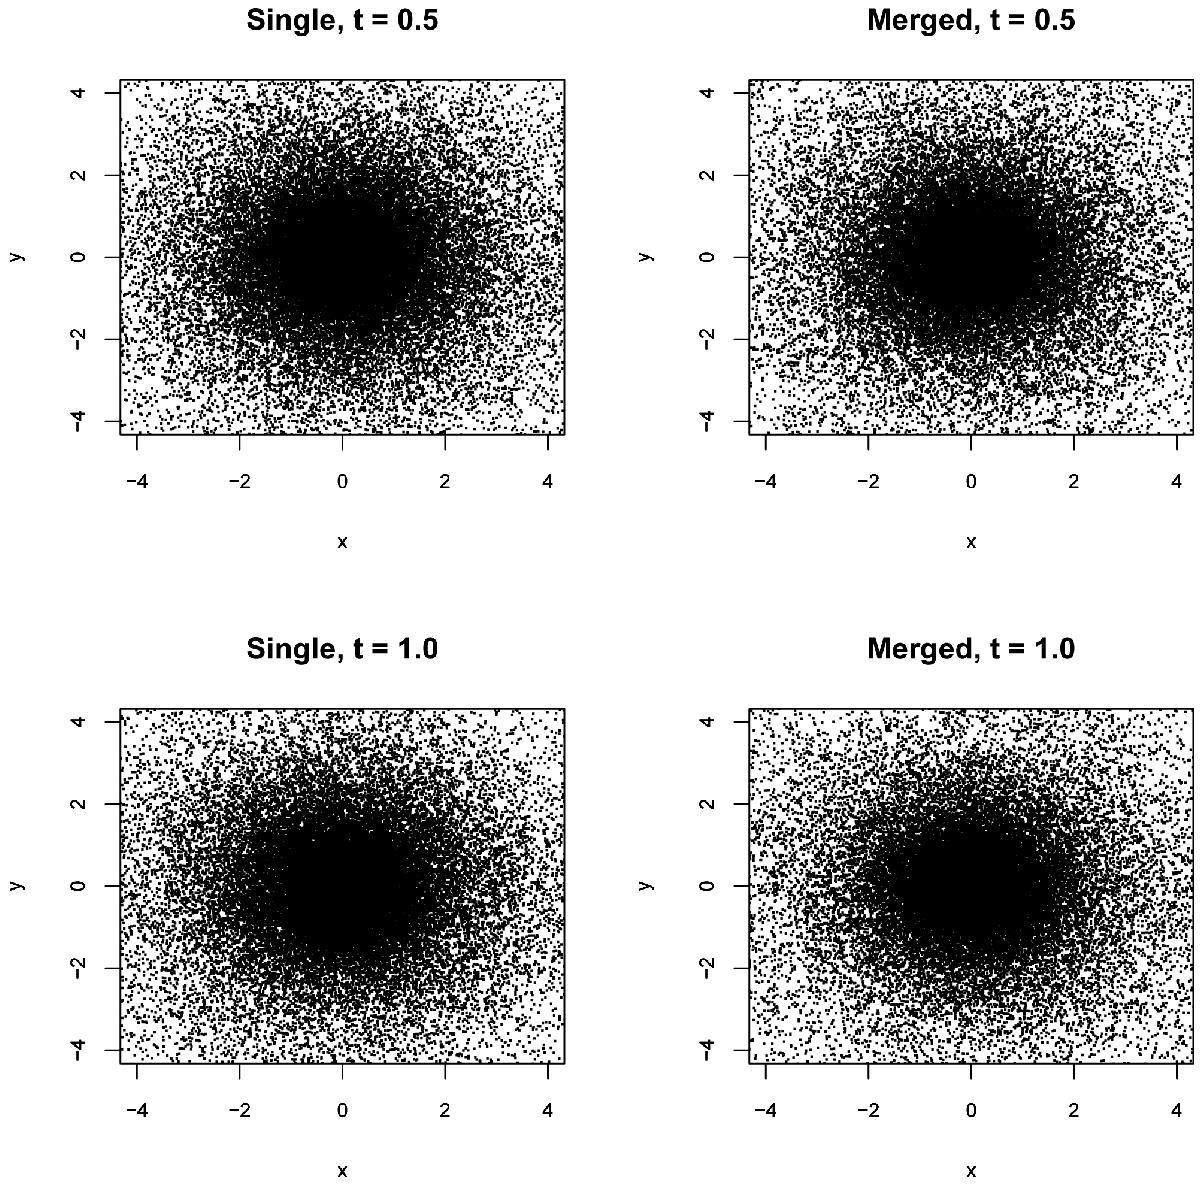
Comparison of snapshots taken from a 64 000-star single cluster (64kW08, left column) and a merger of two 32 000-star clusters (32kmerge7+7, right column). The rows correspond to different times in units of the single-star cluster half-mass relaxation time. In the plots each point represents a star in the plane of the sky. The x- and y-axis are in units of the projected half-mass radius. It is hard to visually tell the difference between the two snapshots. The bottom panel corresponds to the age-range of the snapshots used for the machine-learning study.
Current usage metrics show cumulative count of Article Views (full-text article views including HTML views, PDF and ePub downloads, according to the available data) and Abstracts Views on Vision4Press platform.
Data correspond to usage on the plateform after 2015. The current usage metrics is available 48-96 hours after online publication and is updated daily on week days.
Initial download of the metrics may take a while.