Fig. 15
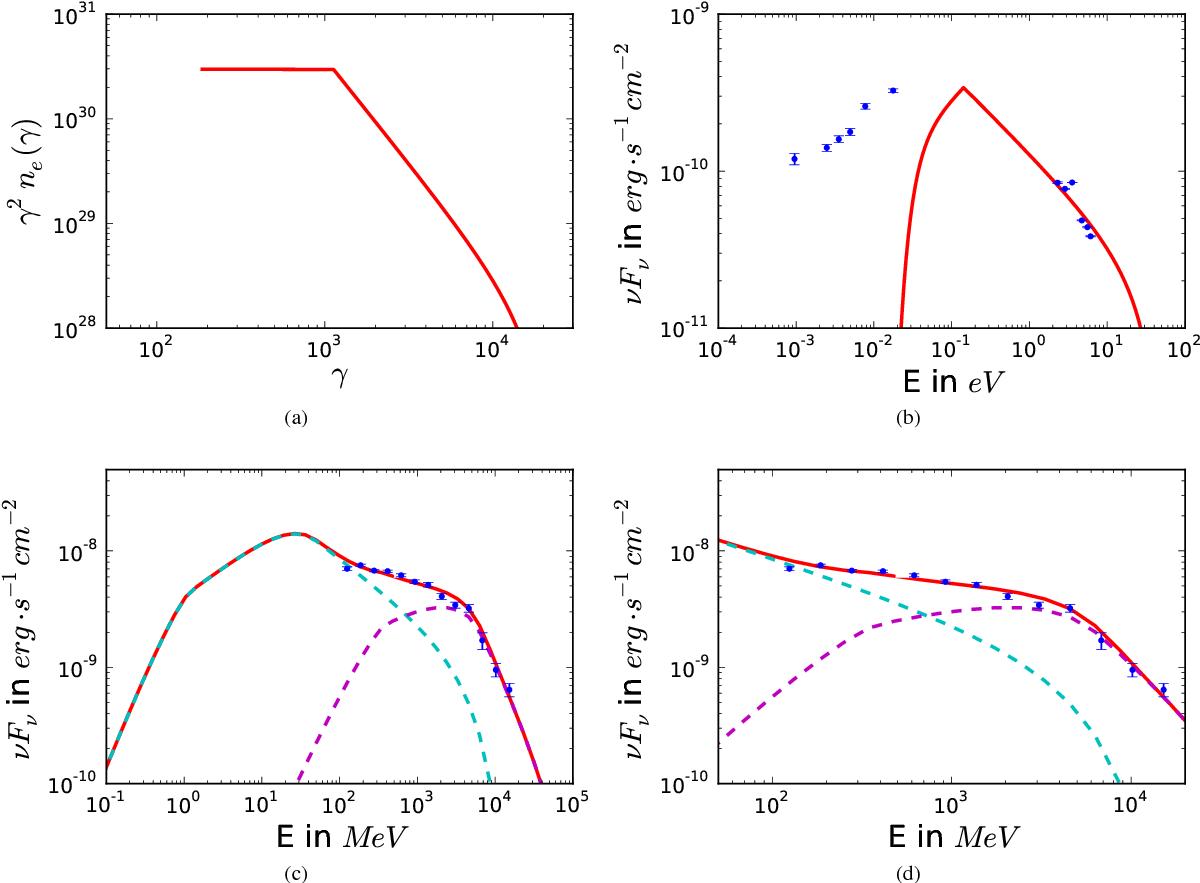
Two-component IC model fit to multifrequency data of 3C 454.3. The model is shown in red with the data points shown in blue. The model parameter values are listed in Table 2. a) Emitting electronspectrum. b) Synchroton spectrum with Swift, Herschel and Submillimeter Array data taken during the November 2010 flare (Wehrle et al. 2012). c) Gamma-ray spectrum with Fermi-LAT data taken during the November 2010 flare (Abdo et al. 2011). d) Zooming into the γ-ray spectrum with Fermi-LAT data taken during the November 2010 flare (Abdo et al. 2011).
Current usage metrics show cumulative count of Article Views (full-text article views including HTML views, PDF and ePub downloads, according to the available data) and Abstracts Views on Vision4Press platform.
Data correspond to usage on the plateform after 2015. The current usage metrics is available 48-96 hours after online publication and is updated daily on week days.
Initial download of the metrics may take a while.