Fig. 2
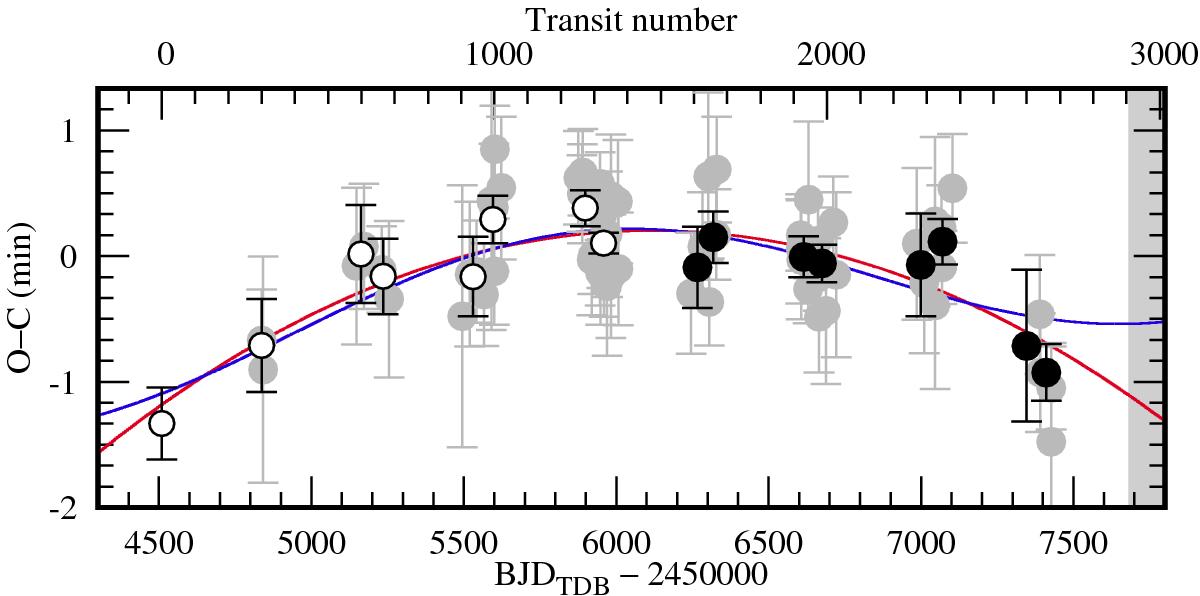
Transit timing residuals from the linear ephemeris. The black open and filled circles denote literature and new data, respectively. Each point represents a half-season average of individual observations, which are marked with gray dots. The continuous line sketches the quadratic ephemeris discussed in Sect. 3. The dashed line illustrates the periodic signal discussed in Sect. 4. The gray area shows the next observing season, in which new data are expected from which we hope to be able to distinguish between both models.
Current usage metrics show cumulative count of Article Views (full-text article views including HTML views, PDF and ePub downloads, according to the available data) and Abstracts Views on Vision4Press platform.
Data correspond to usage on the plateform after 2015. The current usage metrics is available 48-96 hours after online publication and is updated daily on week days.
Initial download of the metrics may take a while.