Fig. 4
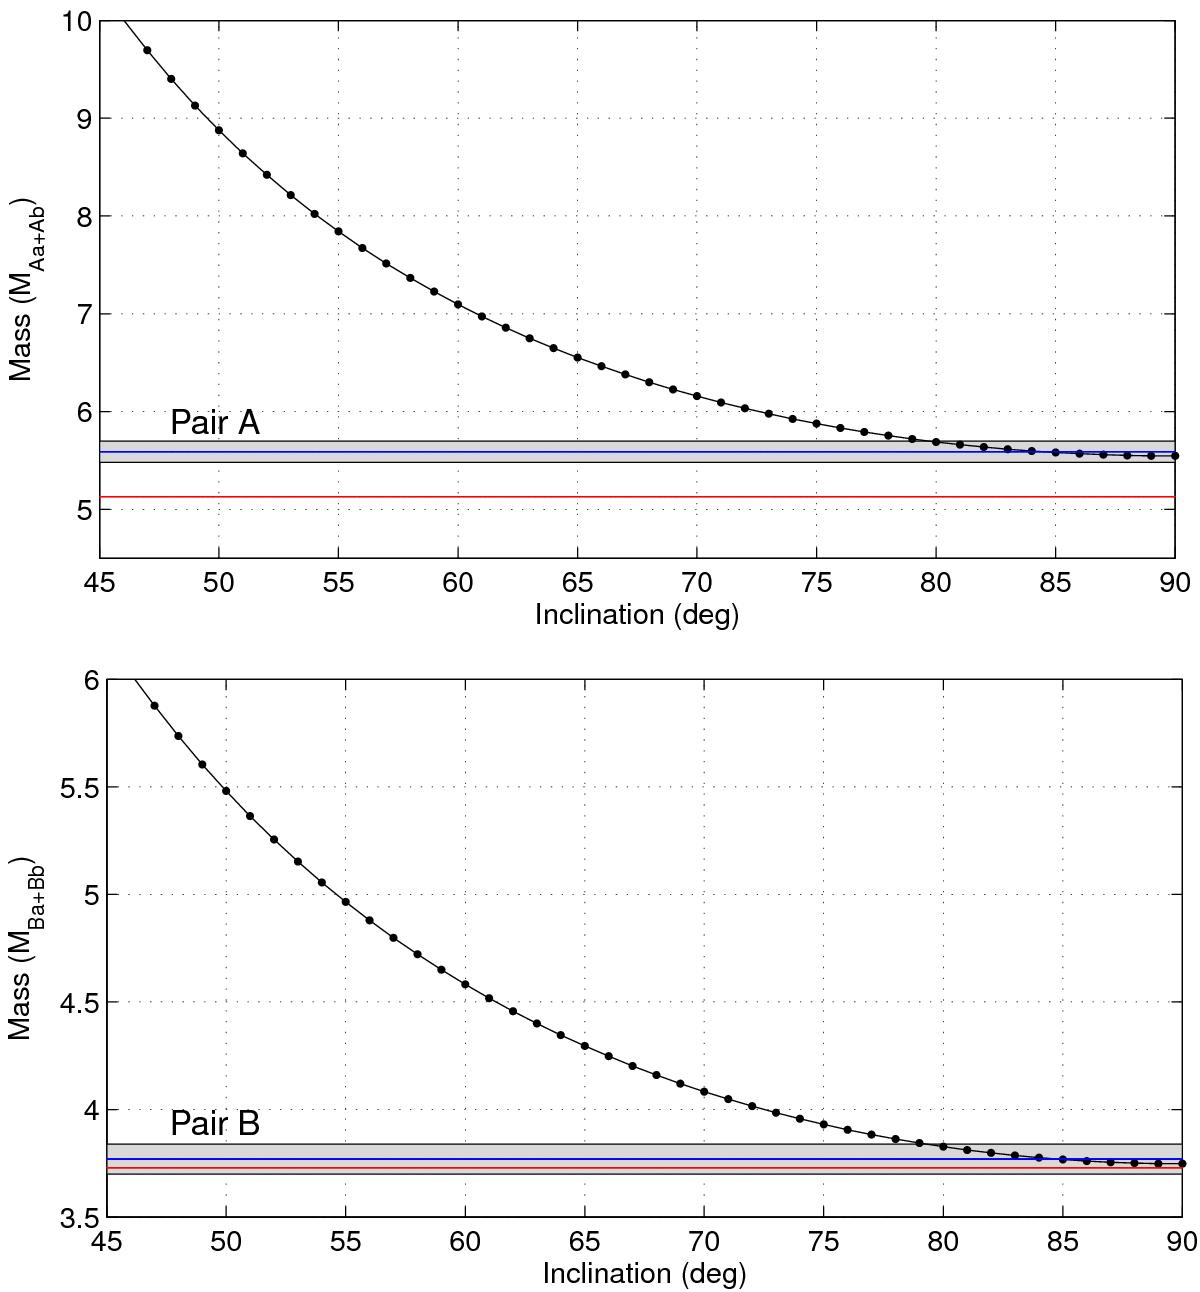
Masses (total mass of the pair A and B) as derived from the analysis of period changes with respect to the inclination of the 2.9 yr orbit. The red solid lines represent the masses reported by Lee et al. (2008), the blue lines stand for the masses from our analysis (with the grey area showing the uncertainties). The black line represents the different masses with respect to the inclination between the orbits.
Current usage metrics show cumulative count of Article Views (full-text article views including HTML views, PDF and ePub downloads, according to the available data) and Abstracts Views on Vision4Press platform.
Data correspond to usage on the plateform after 2015. The current usage metrics is available 48-96 hours after online publication and is updated daily on week days.
Initial download of the metrics may take a while.