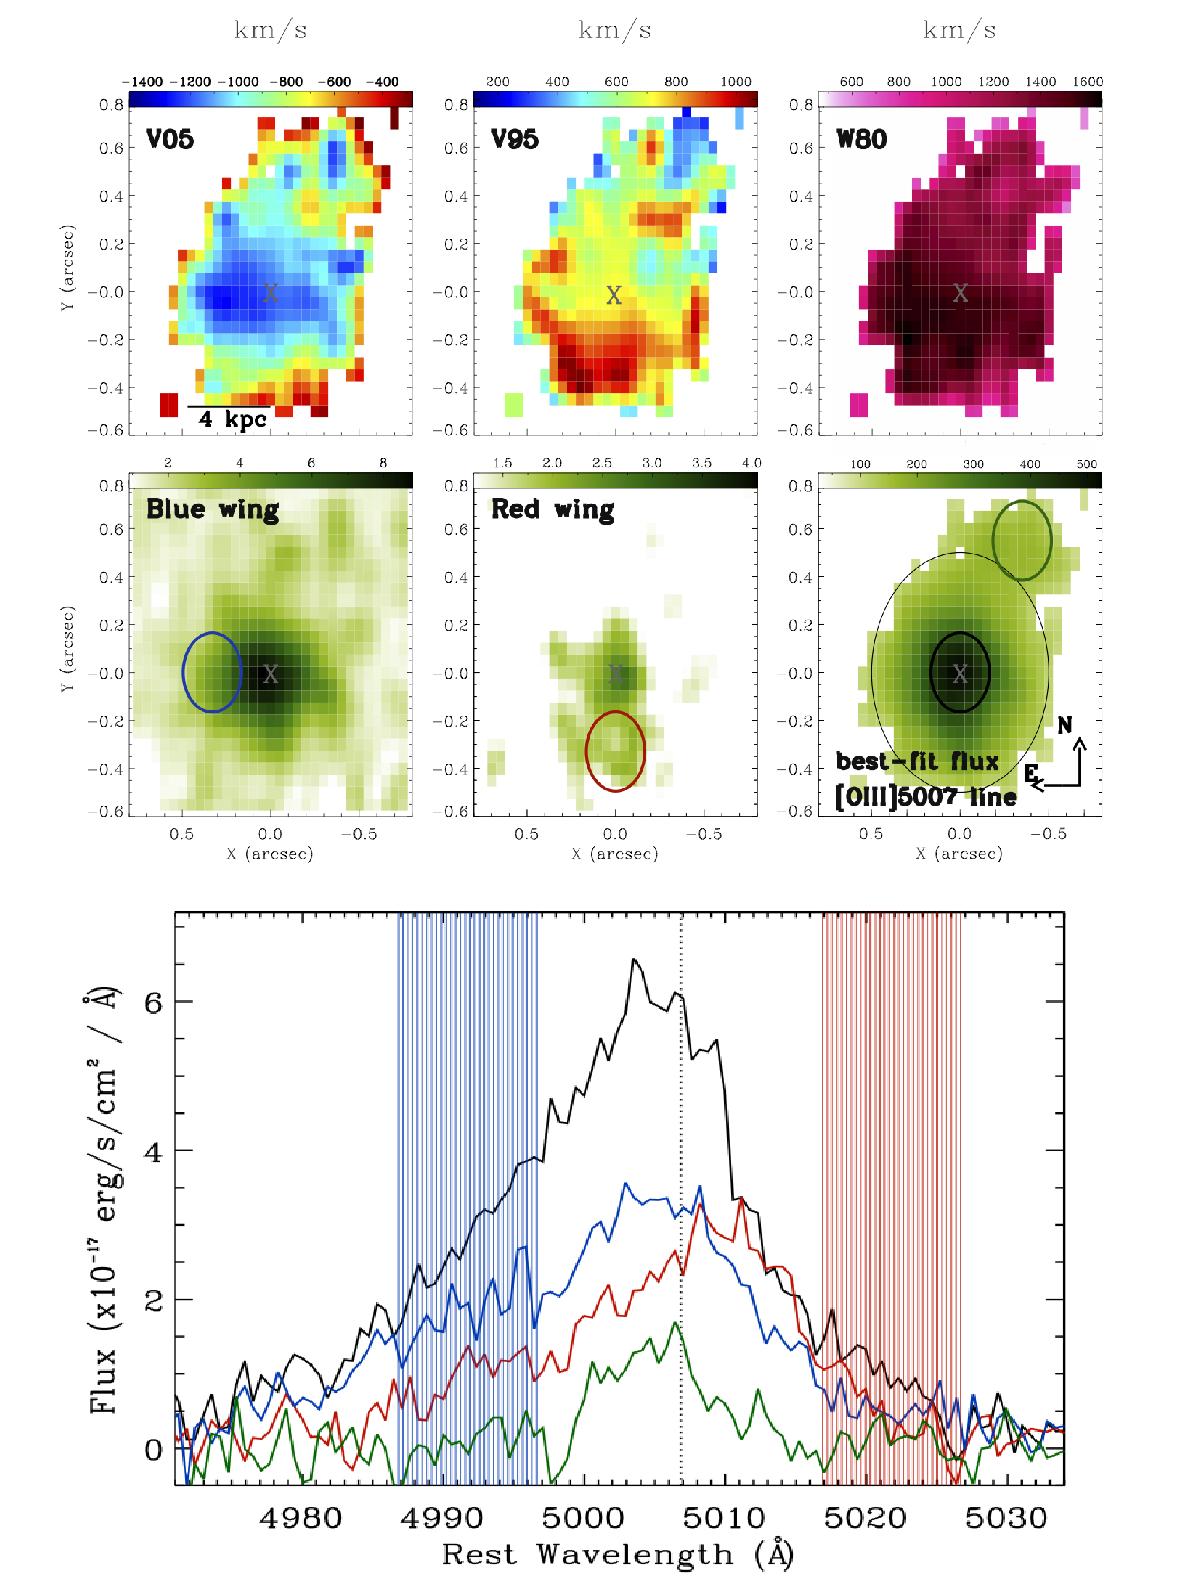
Fig. 8

Top panels: maps across the field of view of maximum blueshifted velocity (v05), maximum redshifted velocity (v95), and line width (w80). Blue-(red) shifted velocities as high as Vmax,blue ~ −1400 km s-1 (Vmax,red ~ + 1100 km s-1) are found at distances as high as 4 kpc from the centre (indicated with a cross). Central panels: SINFONI [O III]5007 maps of the blue (−1200 ÷ −600 km s-1), red (600 ÷ 1200 km s-1), and total [O III] flux (all scales are in units of 10-15 erg cm-2 s-1). In the last panel we also plot as a reference the N-E direction, the J-band PSF, and the 0.4′′ and 1′′ diameter regions around the nucleus (sse Sect. 4.1 and 4.2). Bottom panels: SINFONI J-band spectra of the [O III]5007 line extracted from three regions of the size of the PSF at the position of the nucleus (black line; from the black circle in the total flux map), of the region with maximum Vmax,red values (red line; from the red circle in the red wing panel), of the region of maximum Vmax,blue values (blue line; from the blue circle in the blue wing panel), and at the position of the plume (green line; from the green circle in the total flux map). The shaded regions show the wavelength ranges over which the blue and red wing flux maps have been collapsed.
Current usage metrics show cumulative count of Article Views (full-text article views including HTML views, PDF and ePub downloads, according to the available data) and Abstracts Views on Vision4Press platform.
Data correspond to usage on the plateform after 2015. The current usage metrics is available 48-96 hours after online publication and is updated daily on week days.
Initial download of the metrics may take a while.


