Fig. 6
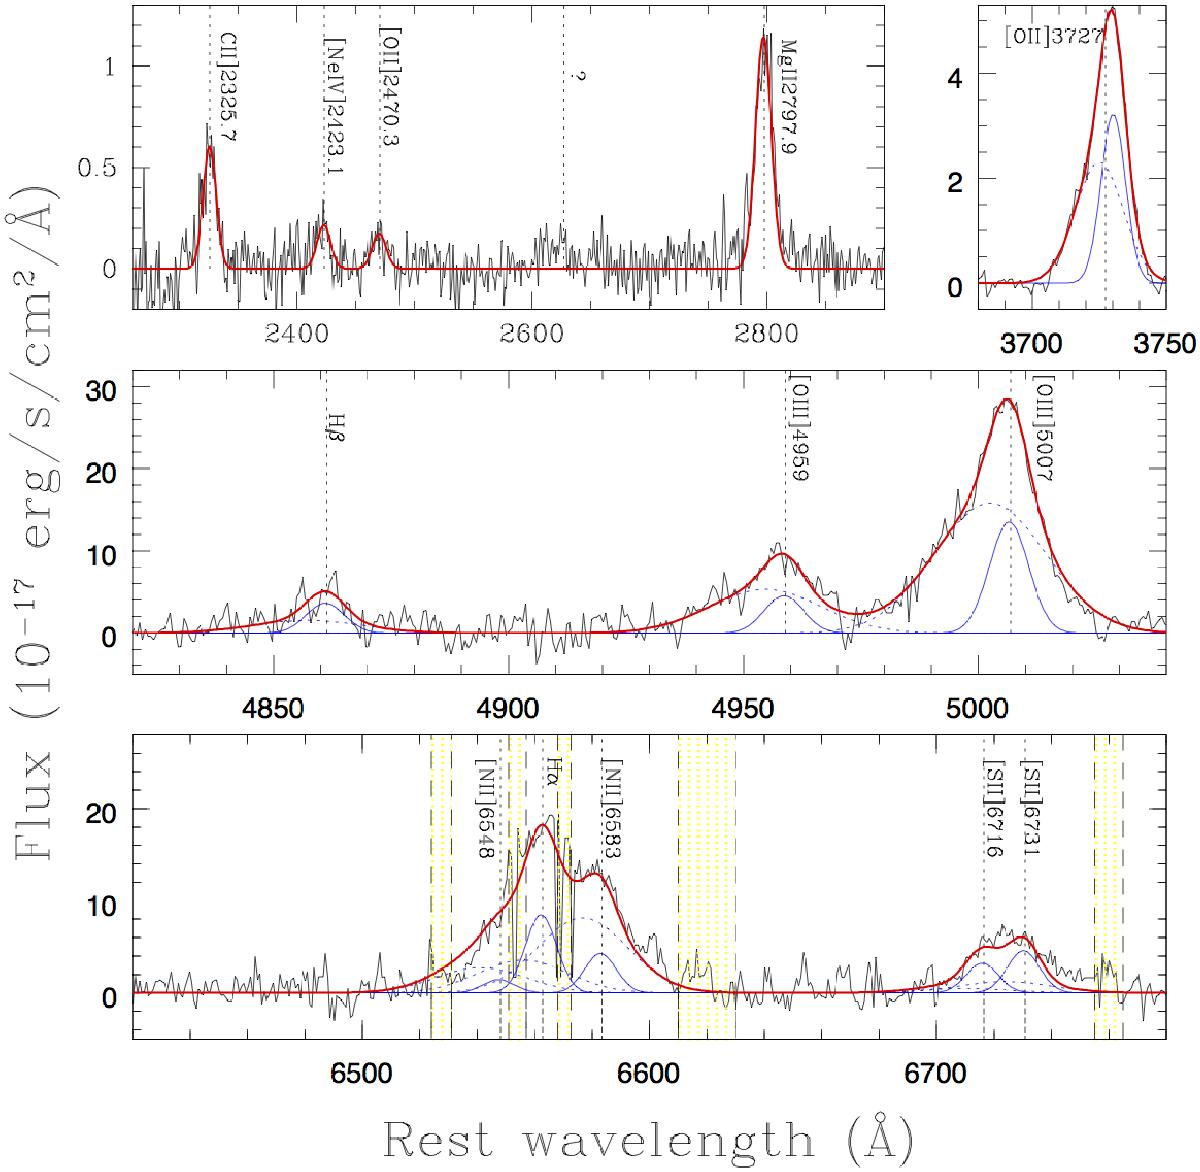
Top: VIMOS spectrum shows in two zoomed regions the 2300−2900 Å rest-frame wavelength range and the [O II] emission. Central: SINFONI J-band spectrum extracted within an aperture of 1′′ diameter from the nucleus around the Hβ+[O III] emission lines region. Bottom: SINFONI H-band spectrum extracted within an aperture of 1′′ diameter from the nucleus around the Hα+[NII]+[SII] emission line region. Spectra are plotted in the rest-frame system; continuum emission has been subtracted from the VIMOS spectrum. Superimposed on the spectra are the best-fit components of our simultaneous, multicomponent fit (solid and dashed blue curves). The red solid curves represent the sum of all model components. From left to right, top to bottom, black dotted lines indicate the wavelengths of the [C II], [NeIV], [O II]2471, MgII, [O II]3727, Hβ, [O III]4959, 5007, [NII]6548, Hα, [N II]6583, and [S II]6716, 6731 emission lines. Yellow shaded regions indicate wavelength of intense sky lines in the NIR spectra, affecting mostly the Hα line, which were excluded from the fit. The emission line at λ ~ 2628 marked with “?” is also observed in the near-UV spectrum of NGC 1068 (see e.g. Raemer et al. 1998) without an associated idenfication.
Current usage metrics show cumulative count of Article Views (full-text article views including HTML views, PDF and ePub downloads, according to the available data) and Abstracts Views on Vision4Press platform.
Data correspond to usage on the plateform after 2015. The current usage metrics is available 48-96 hours after online publication and is updated daily on week days.
Initial download of the metrics may take a while.