Fig. 14
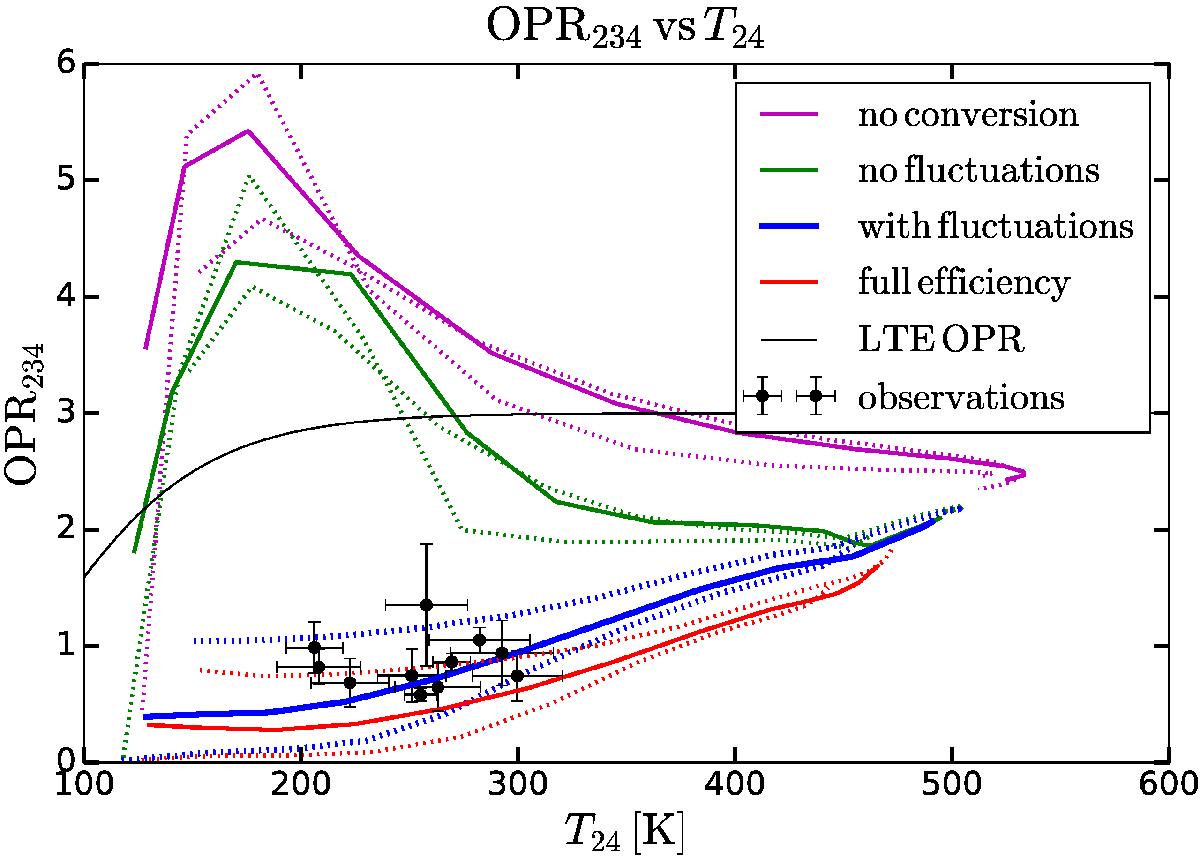
OPR computed from levels J = 2, 3,and4 as a function of the excitation temperature T24, comparing PDR observations (symbols) to PDR models (lines). PDR models implement four prescriptions for ortho-para conversion on grains: no conversion (purple), rate equation approach without fluctuations (green), statistical approach with fluctuations (blue), and full conversion (red). Solid lines correspond to models with P/χ = 104, while models with P/χ a factor of 5 above and below this value are shown as dotted lines.
Current usage metrics show cumulative count of Article Views (full-text article views including HTML views, PDF and ePub downloads, according to the available data) and Abstracts Views on Vision4Press platform.
Data correspond to usage on the plateform after 2015. The current usage metrics is available 48-96 hours after online publication and is updated daily on week days.
Initial download of the metrics may take a while.