Fig. 11
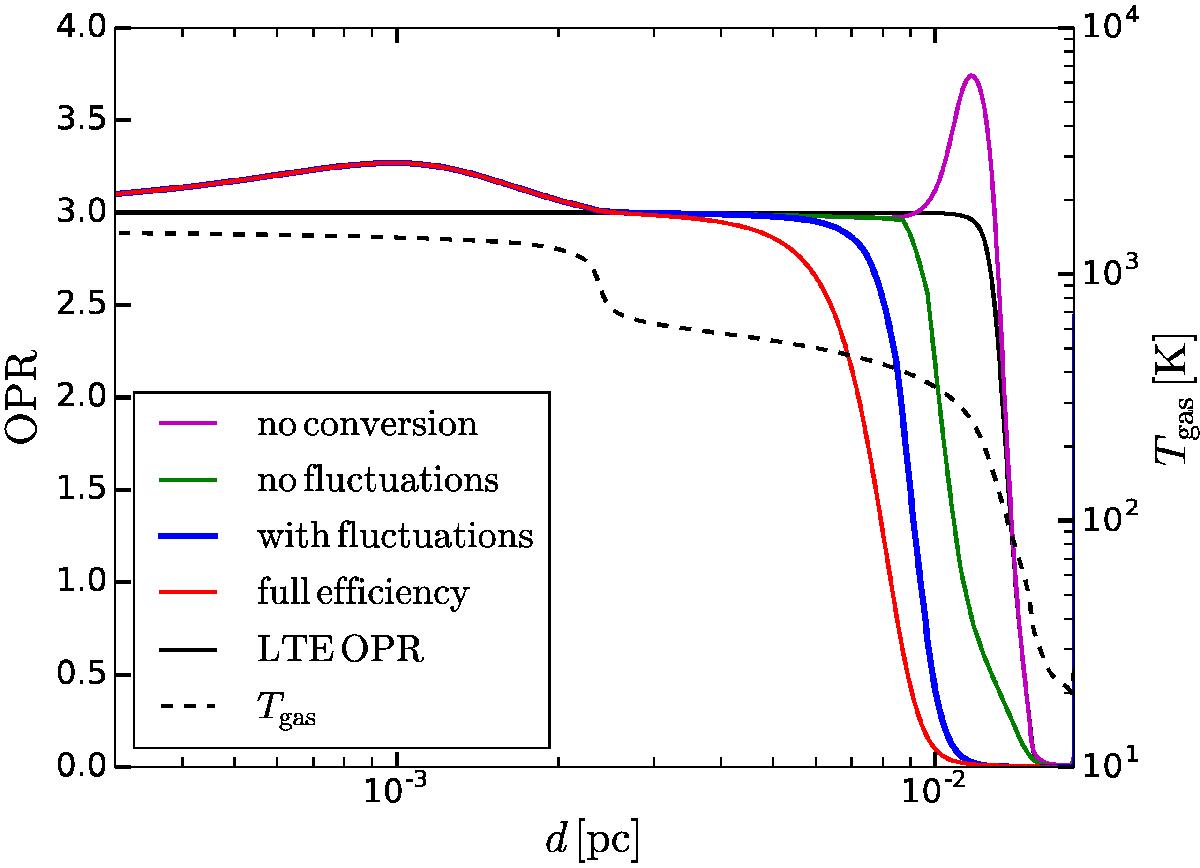
Comparison of the local OPR profiles in the PDR in models with P = 107 K cm-3 and χ = 103 for the four prescriptions for ortho-para conversion on grains: no conversion (purple), rate equation approach neglecting the fluctuations (green), statistical approach taking the fluctuations into account (blue), and full conversion for H2 molecules sticking to grains (red). The temperature profile of the PDR is also shown for reference (dotted black line), along with the corresponding LTE OPR profile (solid black line).
Current usage metrics show cumulative count of Article Views (full-text article views including HTML views, PDF and ePub downloads, according to the available data) and Abstracts Views on Vision4Press platform.
Data correspond to usage on the plateform after 2015. The current usage metrics is available 48-96 hours after online publication and is updated daily on week days.
Initial download of the metrics may take a while.