Fig. 10
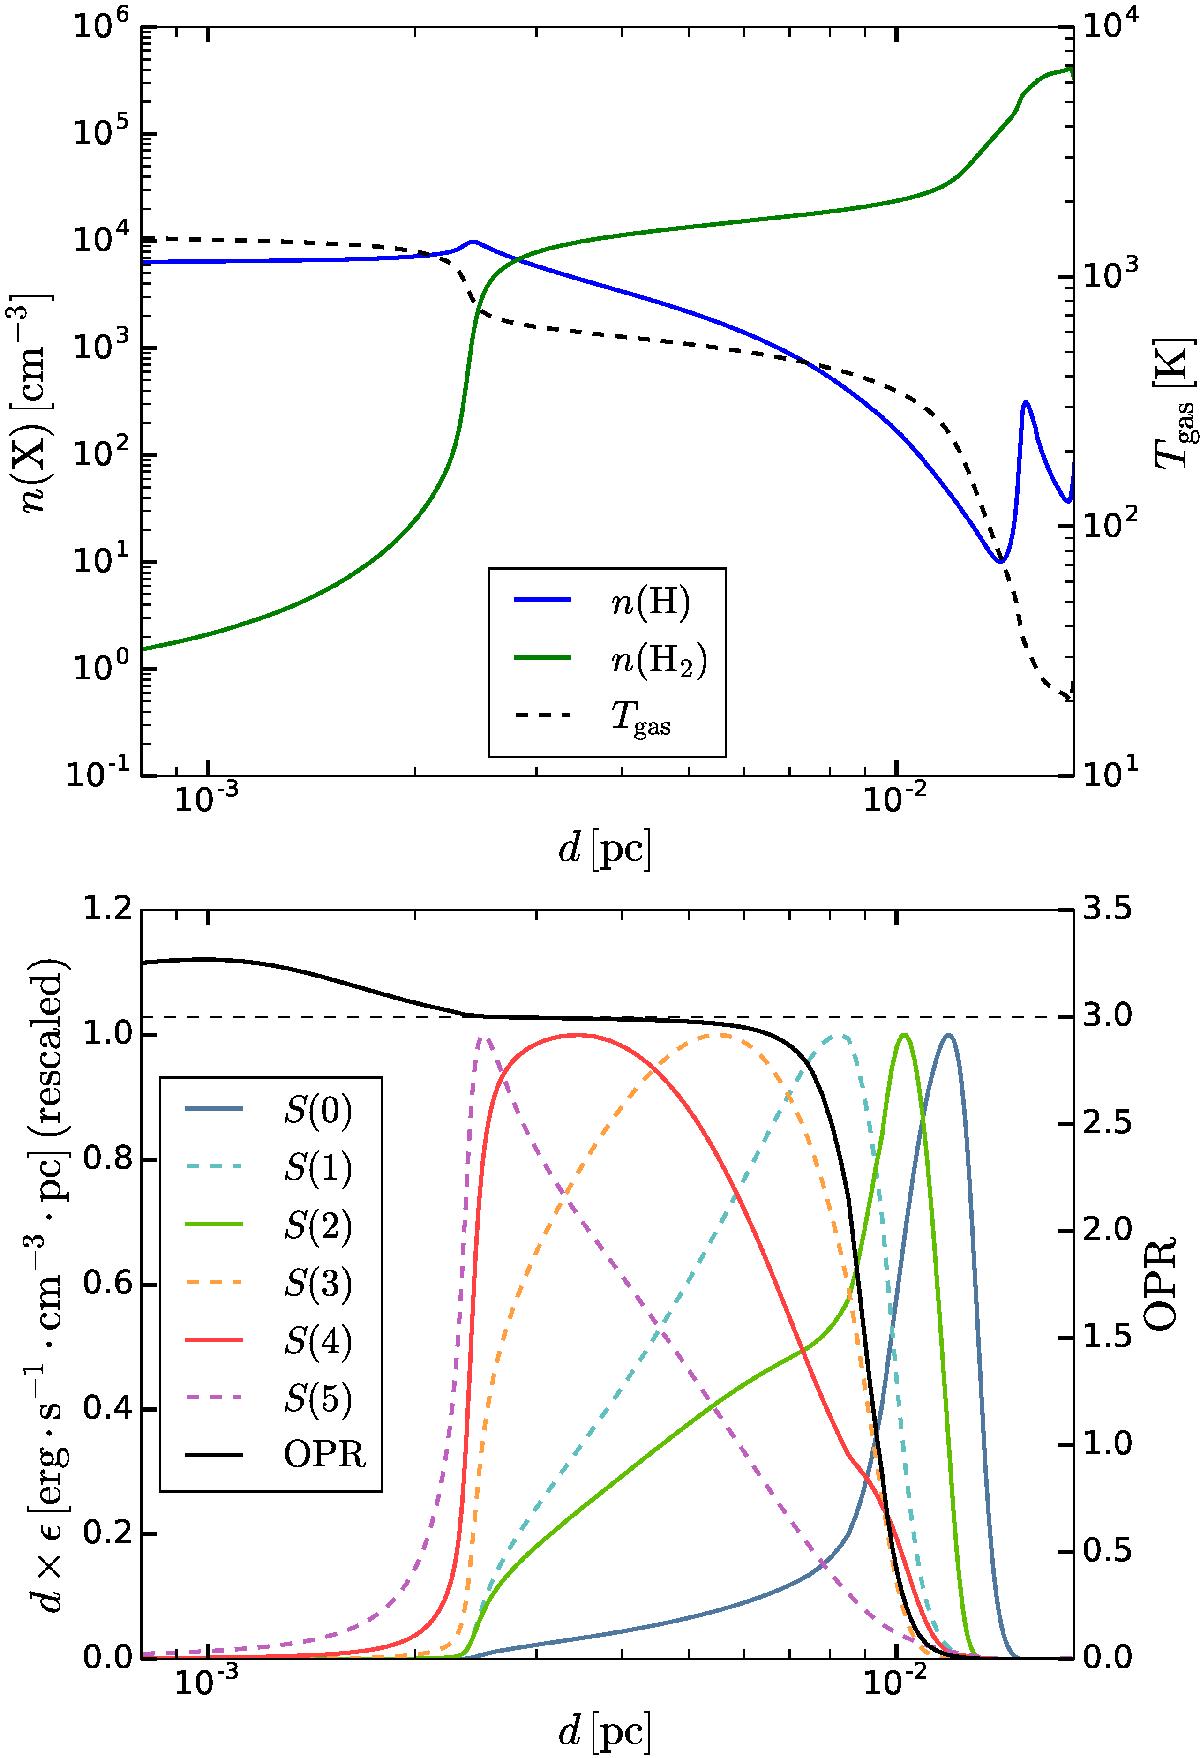
Upper panel: density profiles of H (blue) and H2 (green) and gas temperature profile (red) in the PDR (P = 107 K cm-3, χ = 103). Lower panel: local emissivity profiles (color lines) of the first rotational lines of H2 (solid lines for para transitions and dashed lines for ortho transitions) compared to the local OPR profile (black). Local emissivities are multiplied by d so that the contribution of a given region to the total intensity is proportional to its area under the curve despite the logarithmic axis. Each emissivity curve has been scaled so that its maximum is 1 for ease of comparison.
Current usage metrics show cumulative count of Article Views (full-text article views including HTML views, PDF and ePub downloads, according to the available data) and Abstracts Views on Vision4Press platform.
Data correspond to usage on the plateform after 2015. The current usage metrics is available 48-96 hours after online publication and is updated daily on week days.
Initial download of the metrics may take a while.