Fig. 2
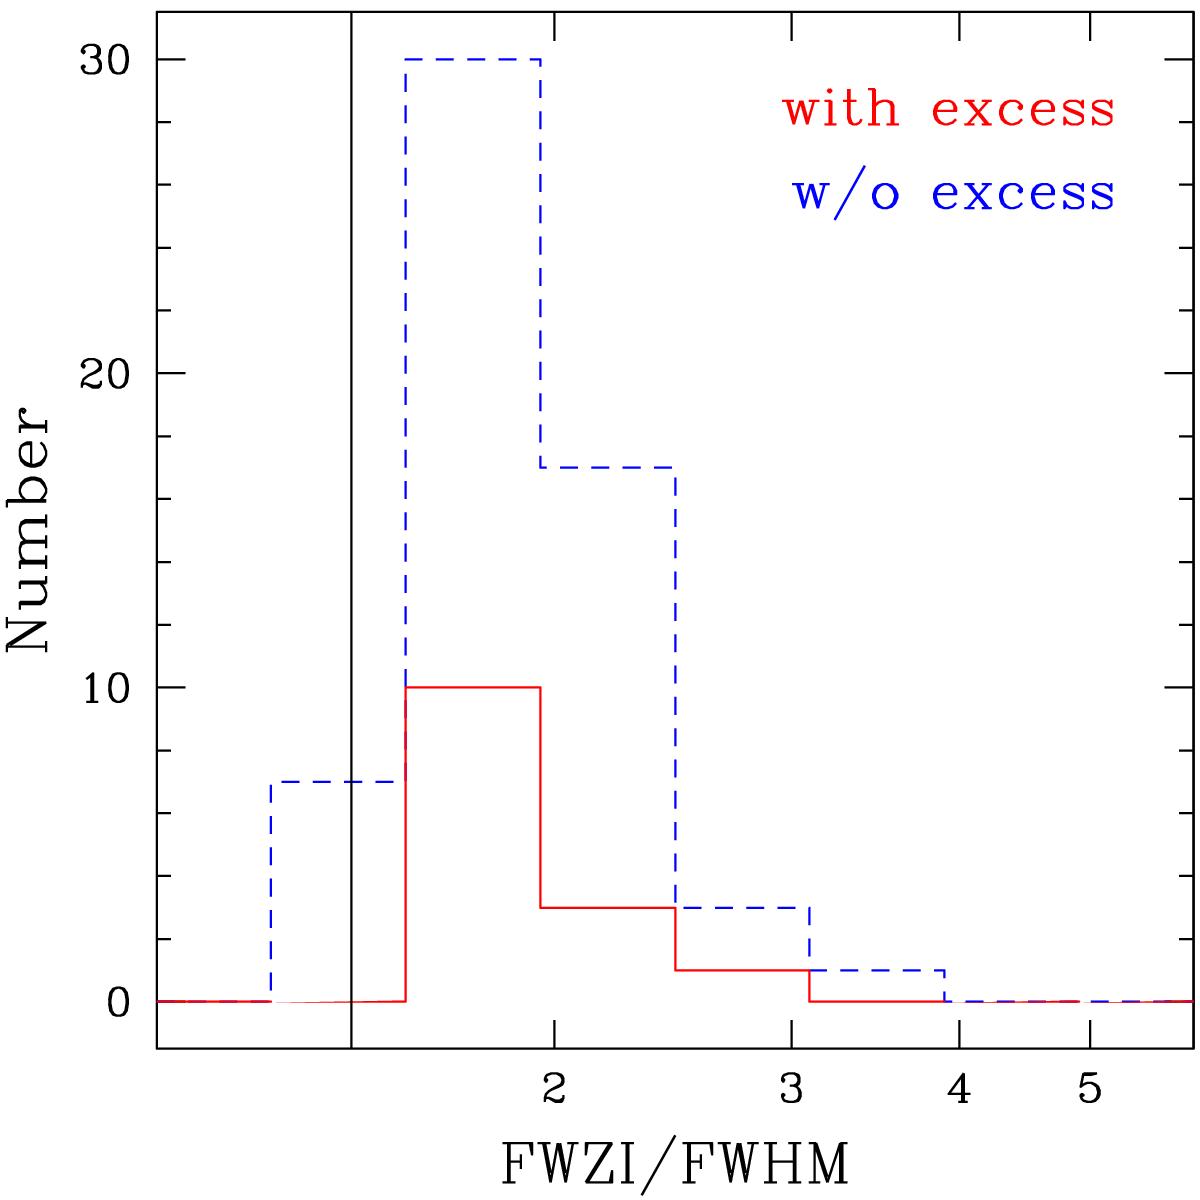
Distributions of the ratio FWZI/FWHM of the SiO(2–1) line for the sources with (red solid histogram) and without (blue dashed histogram) Lyman excess. The FWZI is measured at 25% of the line peak (see text). The vertical line denotes the value of the ratio expected for a Gaussian profile. The bin size has been chosen following the Freedman-Diaconis rule.
Current usage metrics show cumulative count of Article Views (full-text article views including HTML views, PDF and ePub downloads, according to the available data) and Abstracts Views on Vision4Press platform.
Data correspond to usage on the plateform after 2015. The current usage metrics is available 48-96 hours after online publication and is updated daily on week days.
Initial download of the metrics may take a while.